Going global with ETF product
In this stack, we look at ASX listed Exchange Traded Product (ETP) and a short list of equity ETFs that can be used to build non-Australian exposure via a local account.
(This is the first in a series on ASX-listed ETFs)
2001 A Space Odyssey is one of my all-time favorite movies.
It does not matter how many times I watch it I still cannot figure out the ending.
There is Dave Bowman meeting himself and a giant space baby looking at the Earth.
You need 1960s grade LSD to make sense of that.
Nonetheless, I like the expanded consciousness vibe, and if the robots are to rule then you may as well have HAL 9000 do it, since the voice sounds really calm.
Now that AI can clone voices, a HAL 9000 doorbell would be cool.
Here on Planet Yabby we like the bird’s eye view from Space.
The Earth is a big place, with plenty of nooks and crannies worth investigating.
Here we discuss how to buy other pieces of the Planet on the ASX.
I will make a short-list of ASX listed Exchange Traded Products (ETP) and dissect them.
The object of this exercise is to build towards global model portfolios.
The place to start is with a few ASX stocks alongside Exchange Traded Funds (ETF).
Later I will return to global stock picks to supplement this approach.
However, it makes sense to start at the beginning with core and satellite portfolios.
What the heck is a core plus satellite portfolio?
The financial industry is chock full of jargon to keep marketers in clover.
Every few years, the industry invents new jargon to describe the bleeding obvious.
Core-plus-satellite investing is fancy way of saying two obvious things at once:
It is good to have some investments working for you over the long term
The world changes so there will be opportunities in the shorter term
The longer-term buy and hold assets go into the core portfolio.
The shorter-term trading assets go into the satellite portfolio.
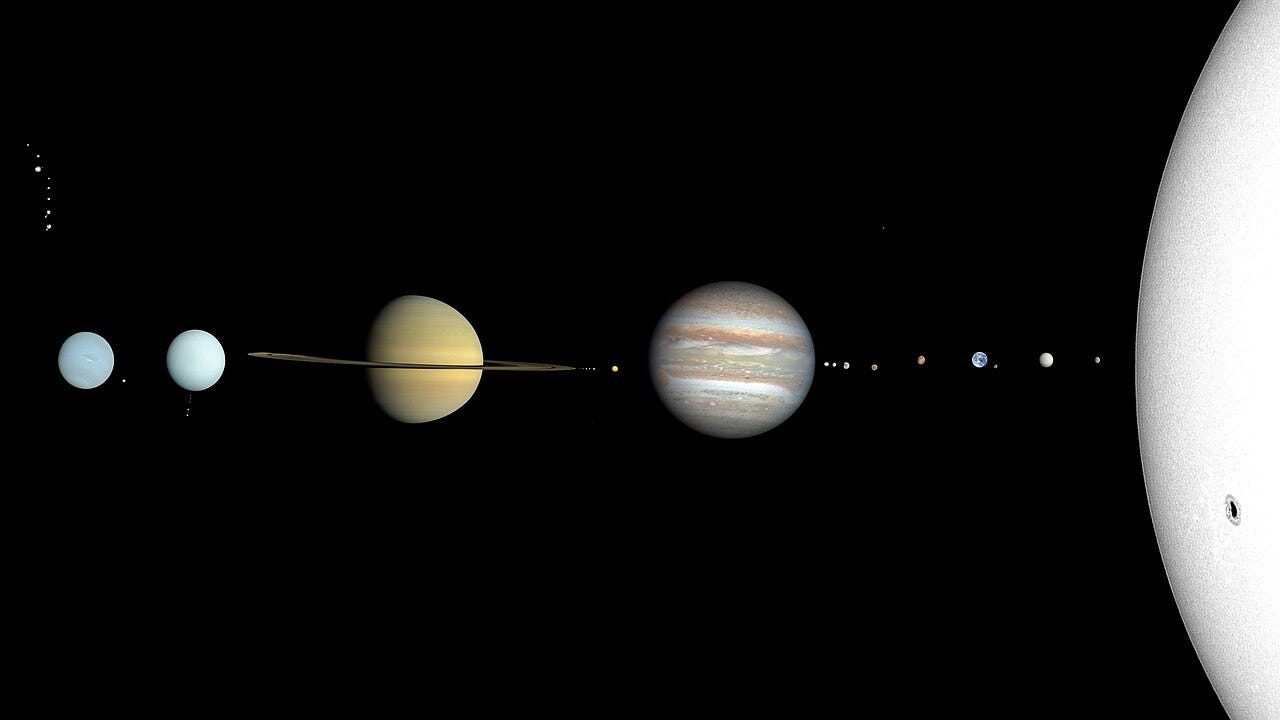
There is an obvious connotation with our solar system.
The sun is at the center of the solar system anchoring the planets as satellites.
For clarity of thinking, you can relate “short” versus “long” term to business cycles.
The Universe is about 15B years old, by current estimates.
That is too long for any investment discussion :-)
The right time scales to think about are:
Quarter and half-year company reporting separated by three to six months
Tax years, separated by one year, when capital gains tax treatment changes
Fiscal years, of one year duration, when you get company annual reports
Electoral cycles of three to four years when you get government changes
Corporate capital expenditure cycles of three to five years
Market cycles of nine to ten years related to the business cycle
Real estate cycles of eighteen to twenty years related to long-term financing
Long cycles associated with the technology and energy of fifty years or more
For those who are students of economic history, many of these cycles have names that were assigned by the folks who first analyzed and wrote about them.
I will only list them here, but interested readers may find a good book for more detail.
The simple taxonomy of business cycle periods I work with reads as follows:
Inventory Cycle - the time taken to stock and destock of 3 to 6 months
Kitchin Cycle - the corporate expansion cycle of 3 to 5 years
Juglar Cycle - the primary economic and market cycle of 7 to 11 years
Kuznets Cycle - the primary fixed-asset investment cycle of 15 to 25 years
Kondratiev Cycle - the long-term technology transition cycle of 50 to 60 years
The rationale for this taxonomy is observation of real-world economic data.
These cycles are rooted in empirical observations
They are not some mysterious clockwork, but they are present in the data.
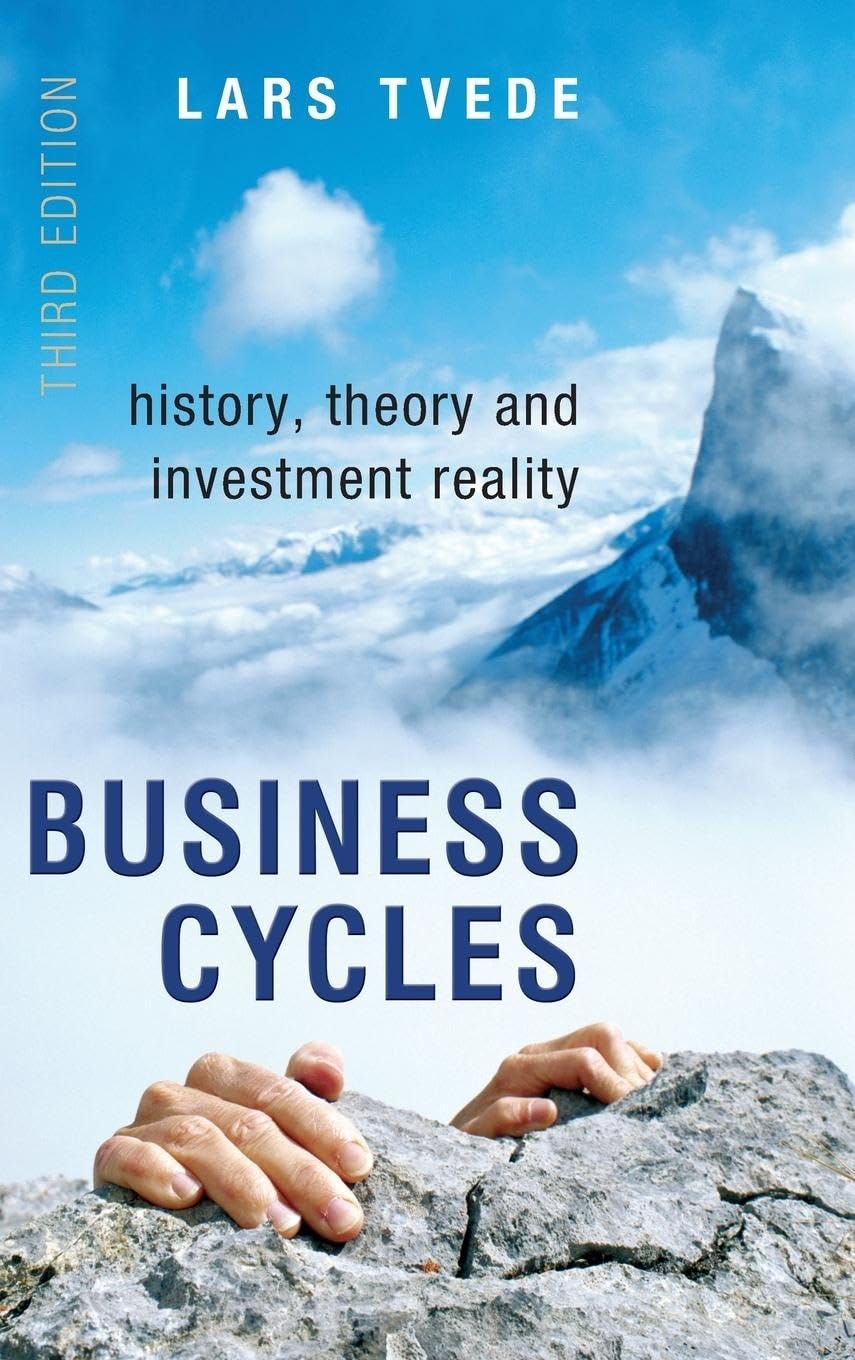
Note that the longer the cycle time, the more controversial it becomes. This is a feature of the business cycle literature, as discussed by Tvede.
I don’t think it is that surprising.
Nobody lives long enough to witness two Kondratiev cycles!
However, if you put aside any fixation on the length of the cycle and focus on the pattern implied by nesting such cycles, with different lags, the idea is not crazy.
Incidentally, the best explanation I know of why business cycles of different periods are real features of the system dynamics is due to U.S. polymath Jay Forrester. He gave the first cogent explanation of the inventory cycle or bullwhip effect.
Forrester published a series of works in the 1960s showing how human decision driven systems with real world lags produce pronounced cycles. The natural lag between the decision and the result of action have delayed consequences.
This can lead to counter-cyclical decisions producing pro-cyclical consequences.
The book Industrial Dynamics develops this idea.
Forrester was an engineer, and his ideas have never found currency in economics.
This makes perfect sense as he maintained humans have difficulty understanding feedback systems, and how the delayed response to action amplifies the cycle.
Anybody who ever flew a plane has encountered pilot-induced oscillation. Similar effects happen with any large vessel. The rudder moves long before the ship.
Central bankers generally study economics and so have trouble with reality.
The history of academic economic theory, the kind which a central banker studied, says that cycles can be tamed by prudent action against policy levers.
Sixty years after the first Cold War started, we are back with a new one!
I read the other day that Elon Musk was going to deter China from fighting a war with the USA through some Space-X magic involving Space Force space cadets flying in a rocket from one side of the planet to the other in 90 minutes!
Of course, this is bunk spruiked by somebody in the Pentagon looking for budget.
China has never expressed any desire to go to war with the USA.
The advent of Cold War II is Kondratiev technology cycle stuff in action.
New technologies, like cheap space-lift, controlled hypersonic flight, massive space based remote sensing, and artificial intelligence, provide new avenues for war.
Those who think war is a good way to solve problems will jump on board.
However, these longer-term technology adoption cycles are not only about grave matters like geopolitics, but they also affect matters like transport, energy, the communication systems we use, what we eat, what we do, and how we live.
These are generational changes happening on the time scale of your pension.
When you reflect on all of this, against the background of your own lived experience, it makes sense to view your portfolio through the lens of different timescales.
There is a portion of your portfolio that needs to fund lifestyle liquidity needs.
There is a portion of your portfolio which can grow into current opportunity.
There is a portion, probably the bulk, which is your wealth to preserve.
In the remainder of this stack, we will deal with the core portion.
This is the wealth you aim to preserve.
I am going to look at equity in this note, which is not the same as capital protection, which would be cash or fixed income. I will get to that in later notes, but for now, many readers have stocks in the bulk of their portfolio.
If you have significant real estate holdings, this is not crazy, since you likely have some immediate living costs, like rental outgoings, or a mortgage, fully covered.
The word preserve is important to elaborate.
In the context of this note, and the series to follow on global stock selection, I am going to interpret preserve to mean two things:
Preservation of the purchasing power of your core wealth holdings
Preservation of your living standards in a time of rapid change
The first is uncontroversial. You can take it to mean “keeping up with inflation” and making sure that you don’t slip behind in the basics of the cost of living.
The second is more difficult, but we think the most relevant to this time.
The backdrop to my thinking is informed by the journey every person takes when they pass the milestone ages of 40, 50 and 60. This is best described as a transition from thinking how you can best survive from your own hard work to that of your capital.
Putting capital to work instead of ourselves is the IQ of retirement planning.
Of course, we can plan our lives better, to save what we have and make opportunity by exploring new avenues for work and personal growth, but the older we become, the more important our capital becomes to the maintenance of our lifestyle.
The conundrum is that the future lifestyle target is changing so rapidly.
What does one do in a world of rapid geopolitical and technological change?
Our answer to this question is as unheroic as it is well informed.
Divide your portfolio into a few well-diversified baskets and watch those.
Here we start the process of identifying some sensible baskets.
Simplify the world into portfolio baskets
What we aim to do, when building portfolios, is to simplify the world.
We cannot know the future, but a couple of things are relative constants.
Nations come and go on timescales longer than our lifetime
Economies change and with that runs investment opportunity
Asset classes behave differently as the world changes
In the investment world of today, the Exchange Traded Fund (ETF) product explosion has made such simplification more accessible. The challenge is that there are now so many to choose from that it can be difficult to know where to start.
I will make this concrete by framing a specific investment scenario.
Consider an Australian investor who can only use ASX listed product.
To keep it simple, I will ignore listed managed investment companies (LIC) and other traditional managed fund products. We will look only at stocks and ETFs.
Common stocks and ETFs are low cost to trade, and easy to manage.
If you do not go crazy trading, there will be a short list of new trades to report to your accountant each financial year end, and one simple account reconciliation.
In the scenario we imagine, you could easily use an online service like Sharesight to keep track of the whole portfolio and do your trade and tax planning.
Create a short list of building blocks
Those who have run a brokerage account for many years know that investing starts with a deceptively simple question:
What can I actually trade?
This is not the same as:
What would I like to buy?
One great example is the Chinese electric vehicle battery company CATL.
Contemporary Amperex Technology Co Ltd SHE: 300750 is a publicly listed stock on the ChiNext stock exchange in China. This is not a stock that I can buy!
I do have professional investor status, which does allow me to buy China A-Shares listed on mainland exchanges, such as Shanghai. However, ChiNext is off limits!
ChiNext is a Shenzen stock exchange like the US NASDAQ.
It has some interesting companies, like CATL, but you need a different level of Chinese government approval, as a foreigner, to buy shares on that particular exchange.
If you think this is a “communist thing”, you will find a similar story with South Korea, Taiwan, and India, among other exchanges in Asia, and the sub-continent.
However, there are US listed ETFs, such as VanEck ChiNext ETF CNXT, that can provide access to a basket of the largest companies on ChiNext. If you buy this, then CATL is 20.31% of the portfolio. This is a crude way to buy CATL, but the only way for many.
Once you understand this principle, it is easier to cut down a long list of potential ETF candidates to a shortlist of useful products you can use as core building blocks.
For our purposes, this is basically a way to carve up the world into regions.
You can have a go to US ETF to cover that, and a few others to cover the rest of the world. Depending on how you think about the world, the list may look different.
Here I will give my own list as a way to demonstrate the thought process.
A short list of ASX listed equity ETFs
There is now an abundance of Exchange Traded Product (ETP) listed on the ASX.
Here I will focus on a selection of core equity ETF exposures that are sufficient to create a core equity exposure to both ASX stocks and global stocks.
The general rule of thumb I used when screening this list was to go with ETFs that have been listed on the ASX for ten years (within a week or so) and have over one billion dollars of capital invested.
This list includes three of the industry stalwarts Vanguard, iShares and SPDR.
The somewhat arbitrary criteria I used to cut a long list to a short list excluded the home-grown provider Betashares. This is not a judgement or recommendation.
Do check out the Betashares product.
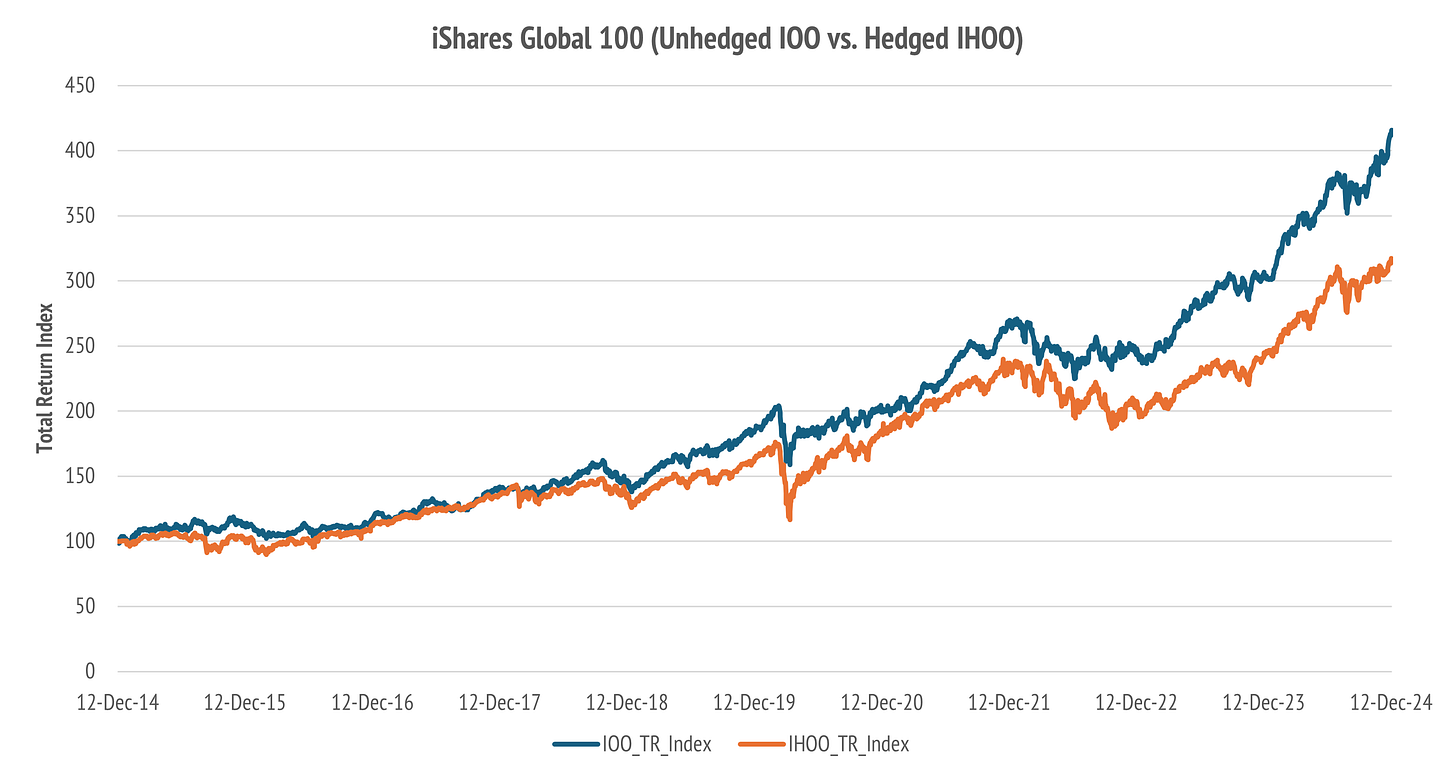
You will also notice that I broke my own rule by including the hedged version of the iShares Global 100 ETF, whose ticker is IHOO. I did this because I wanted to show hedged equity products in action. For reasons shown below, I avoid them.
A word on benchmarks
The other criterion behind this selection is the ETF benchmark.
In a core equity portfolio, I prefer broad large capitalization stock exposure.
This is because you are aiming for a low turnover passive market exposure which will not likely need to be traded very much except to bring weights into balance.
It is easy to make up your mind if the world will still be here in ten or twenty years.
Choosing large capitalization passive holdings means you are weighted towards prior success, and so you are making an implicit bet on that continuing.
The Australian market, the US market, and the largest companies in the global market, are unlikely to all go broke together. Your allocation is driven by risk appetite.
In professionally managed superannuation and pension funds, there is generally a mix of equity, meaning stocks, bonds, meaning fixed income obligations of governments and companies, cash, and so-called alternatives, like infrastructure and commodities.
You can buy exposure to all of these through ETF product.
However, I think this is not the right place to start, as you can always adjust the risk profile of equities down by adding cash. Then you can think of how much cash to invest in things other than equities.
This is a different thought process, because you are generally dealing with lower return assets in a strategic sense, whose risk profile is key to their inclusion.
In asset allocation circles, this is called the growth versus defensive split.
In this article, we are discussing only the core growth exposure of a portfolio.
I will return to the defensive piece later, where a discussion of hedging is relevant.
Let us start with the obvious question:
Why go global at all?
This has a nuanced answer. It is about risk and return.
Does it matter much which provider you use?
Let us start with the obvious question.
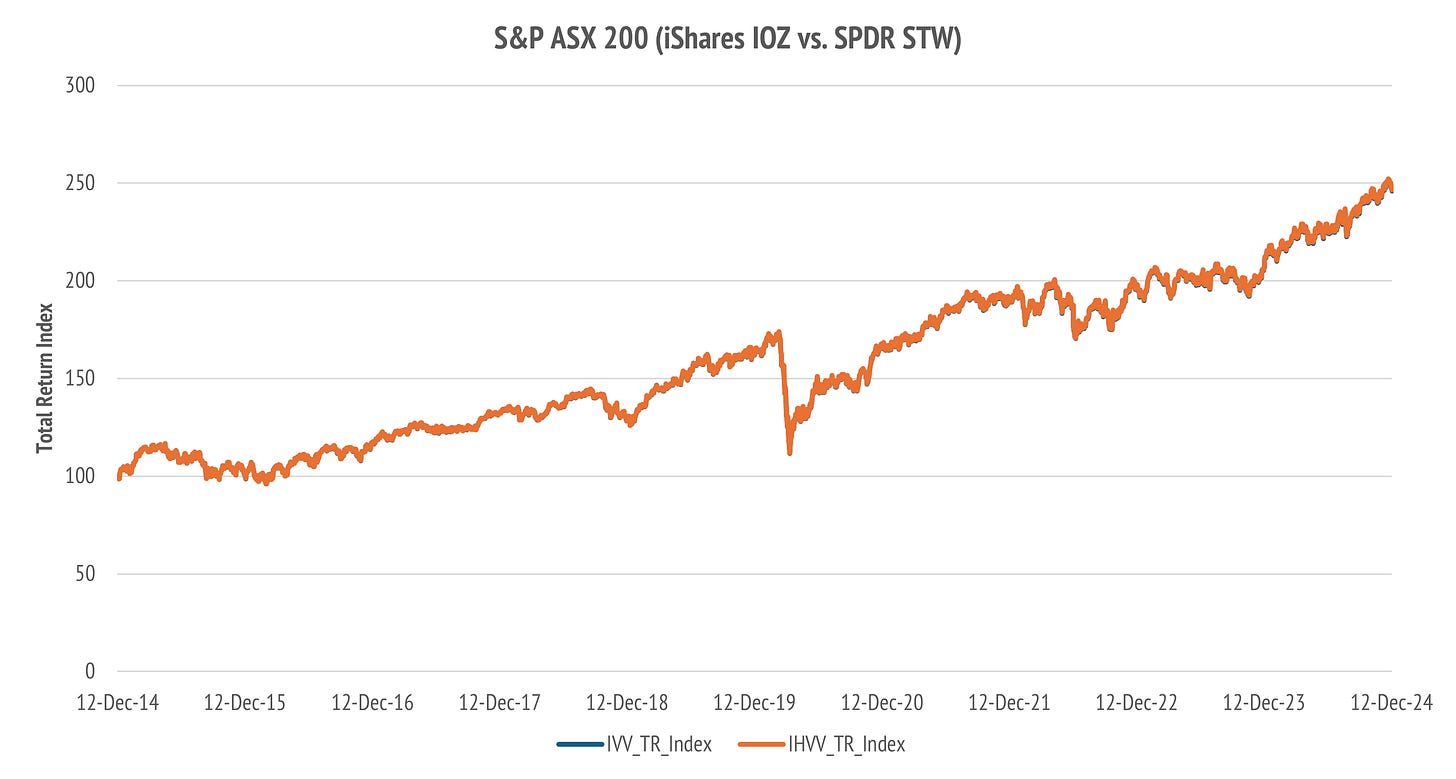
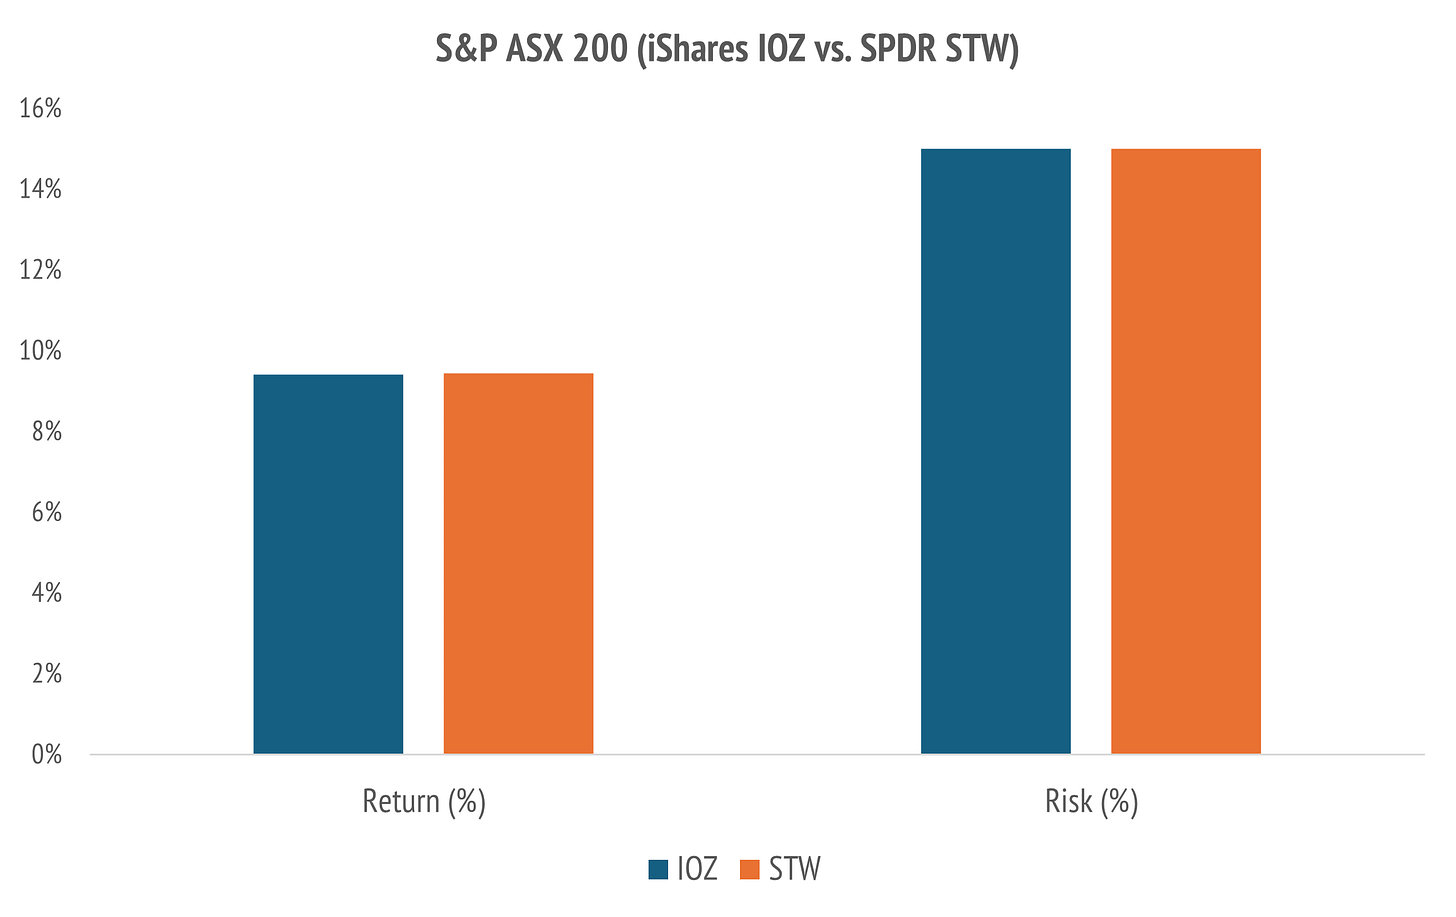
I purposefully included two S&P ASX 200 products.
These are the XASX: IOZ product from iShares and the XASX: STW product from SPDR.
These cost the same with an annual Management Expense Ratio MER of 0.05%.
Here I have estimated the after-tax returns for a buy and hold investor who pays a 15% tax rate on dividend income. The published distributions have franking.
Due to the effect of franking credits on Australian dividend income, the after-tax distribution is about 10% higher, on a deferred basis.
These are crude after-tax return estimates based on average franking credits.
Do not rely on them as a precise estimate, but they are indicative.
Obviously, they depend on your tax rate, and any turnover that generates capital gains tax events. This can be marked for hedged global ETF product.
There are some gotchas with the choice of ETF product provider, connected with the business viability, and product continuity. There are also differences of tax reporting which can make a difference to you when doing your tax return.
However, for vanilla core product, they are the key differences to focus upon.
When I get to doing thematic and satellite ETFs there are other concerns like any credit risk embedded in a structured product, but this is not the focus here.
The USA versus the Rest of the World
We are told that the USA is the exceptional nation.
I don’t buy into the supremacist rhetoric but do acknowledge that the recent return history of stock markets, plus current valuations, makes it rational to split the world into a US equity piece, and a non-US equity piece. It just makes a ton of sense.
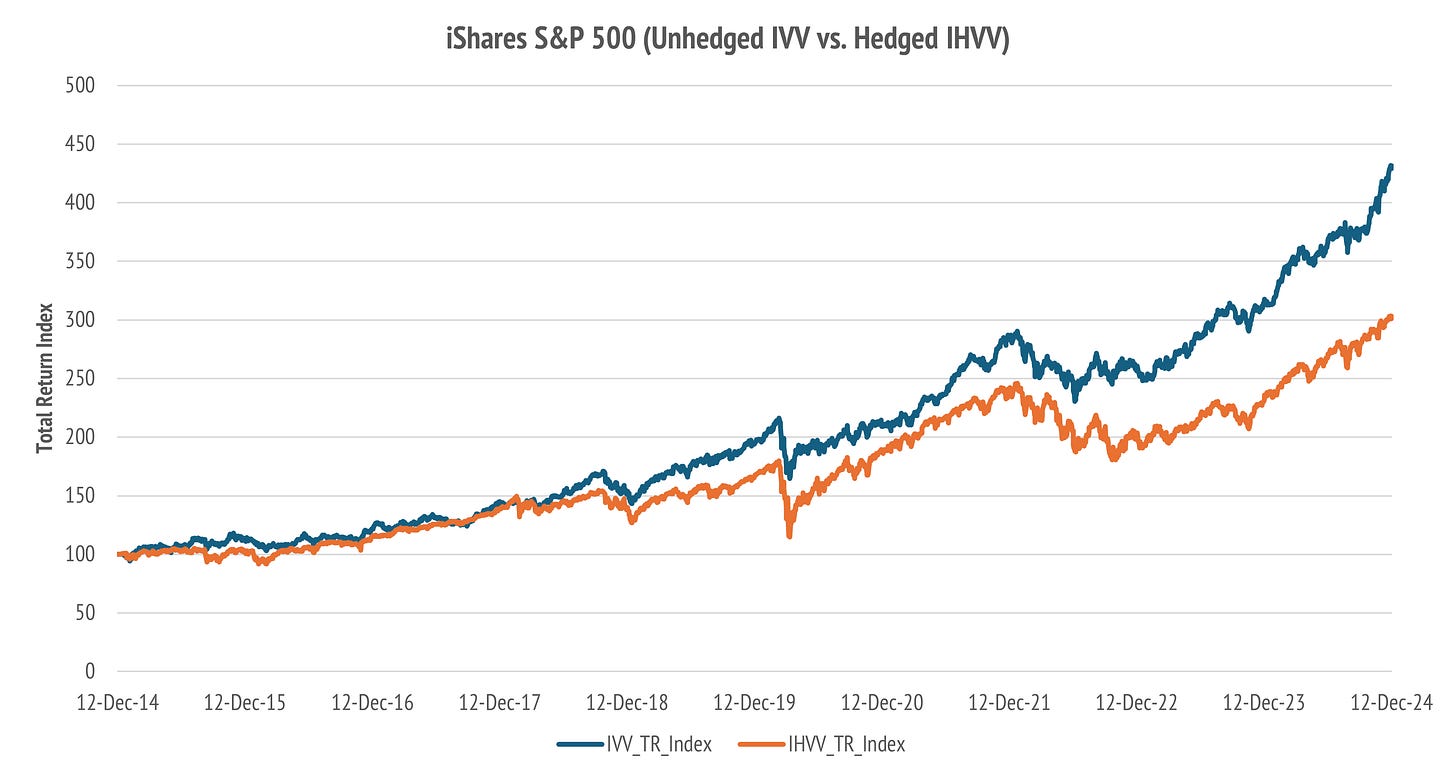
Let us look at large-cap US equity in the form of the S&P 500 hedged and unhedged.
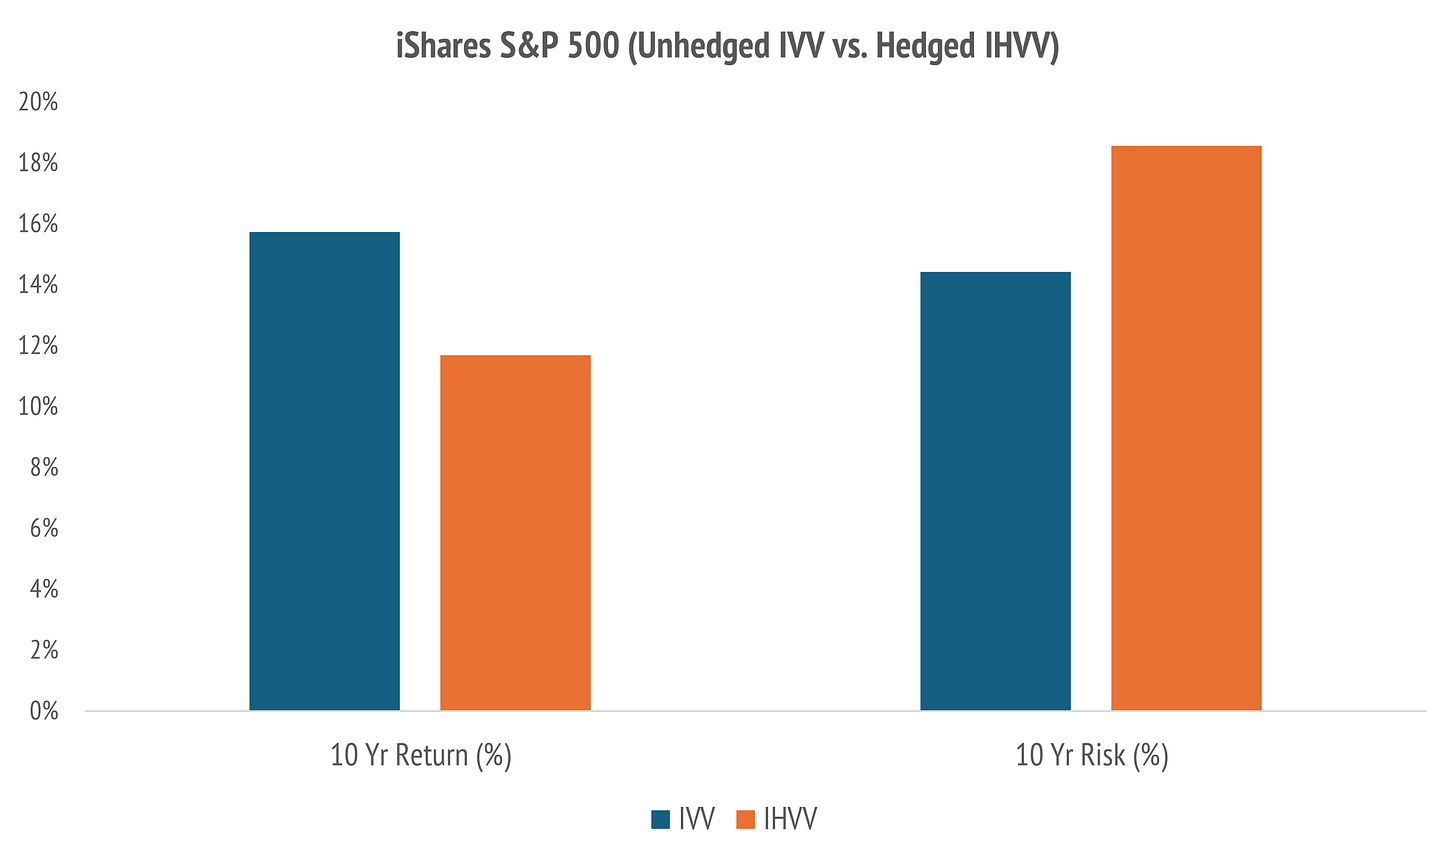
These are the XASX: IVV product and the XASX: IHVV product, both from iShares. You pay only 0.04% p.a. for IVV, but hedging back to AUD costs extra, at 0.10% p.a. The returns shown below are for a 15% tax investor assuming 15% withholding tax.
The effect of foreign tax credits is a wash, provided you can claim those.
Superficially, you only pay 0.06% more for hedging the USD risk, but the reality is more subtle with a number of hedging-related gotchas for US equity.
The return of the AUD-hedged version of the S&P 500 product is lower, and the risk is higher for two reasons. Firstly, the AUD has depreciated versus the USD since 2016. Secondly, there is a phenomenon called natural hedging, whereby the AUD has a tendency to fall considerably whenever there is a major US equity correction.
When an equity portfolio is hedged back to AUD this natural hedging effect tends to spoil the goal of the hedge. This is not true of fixed income.
As a general rule, and as shown below, I prefer to run global equity unhedged, and to choose hedging for fixed income products. The subject is complicated, but the simple version is that bond markets tend to go up in value when equity markets fall.
I will discuss this more thoroughly when we come to fixed income.
You can see from the above table that the real cost of hedging was not 0.06% but more like a 4% lower return achieved at 4% higher risk.
That is a bad deal in any language.
The Developed World versus Australia
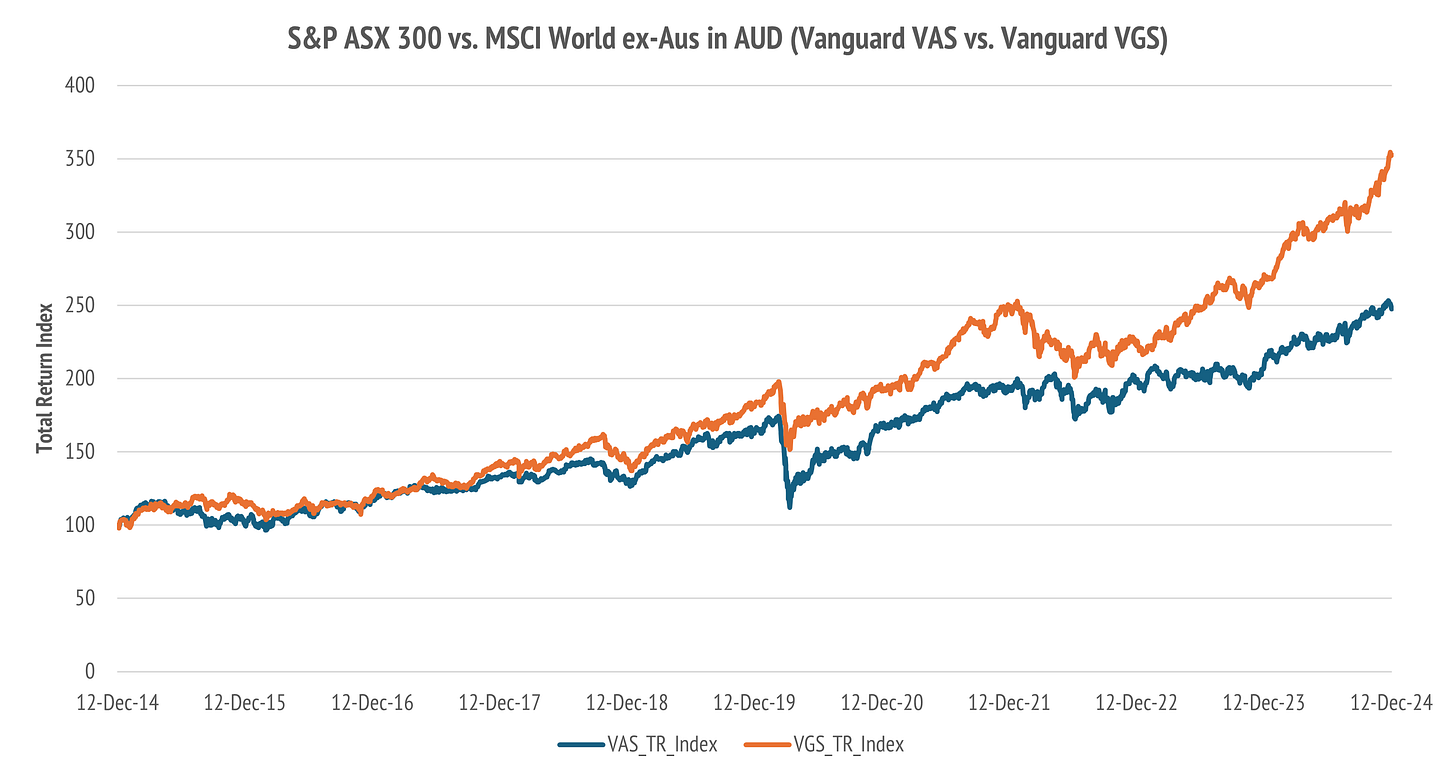
Recognizing that the USA is upwards of 70% of global equity markets, let us now look at a low-cost core equity portfolio using broad Vanguard products.
These are the XASX: VAS product, which uses the Australian S&P ASX 300 benchmark and the XASX: VGS product, which tracks the MSCI World ex-Australia benchmark.
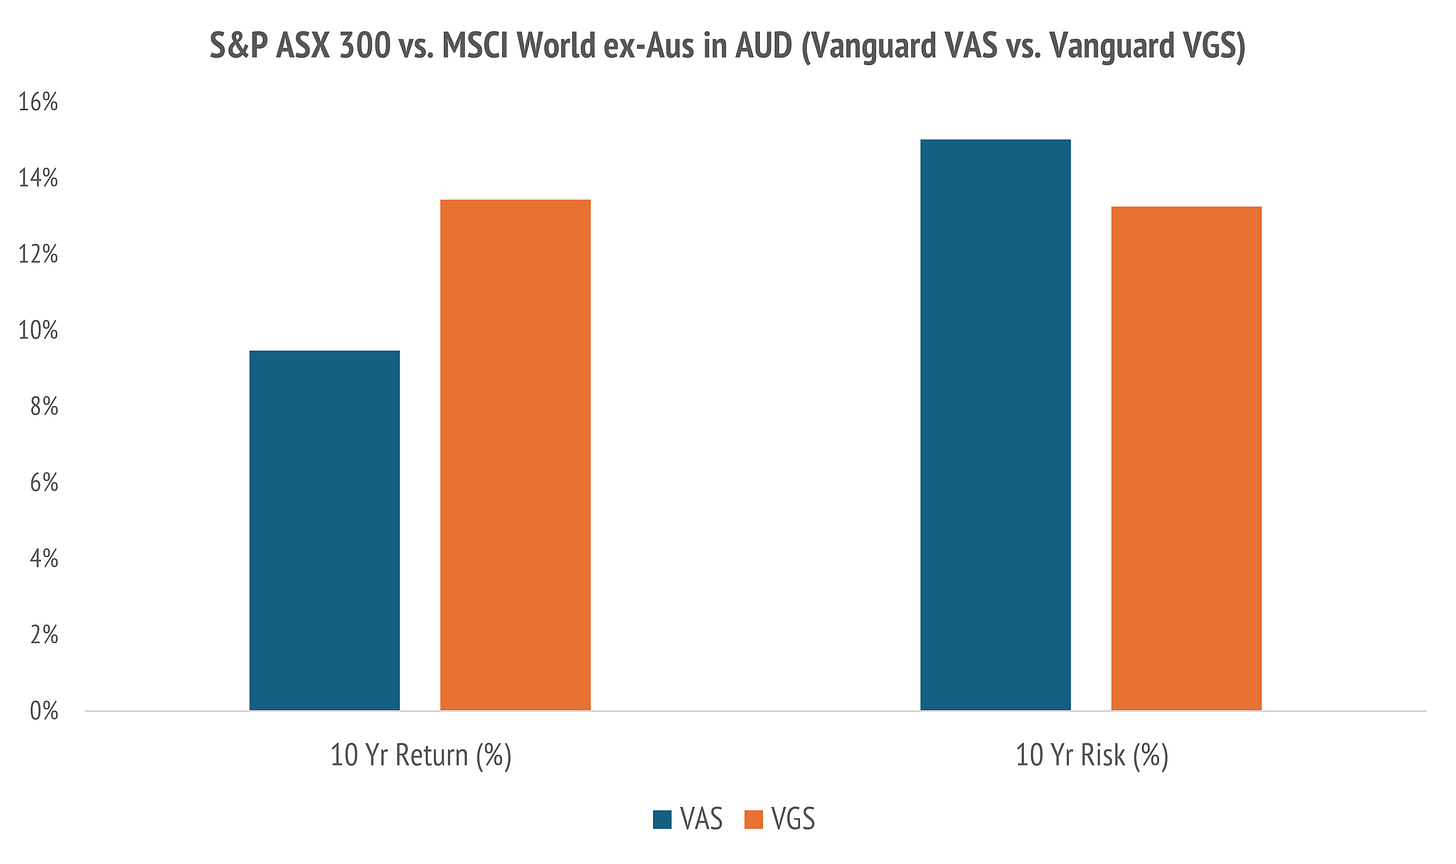
You pay only 0.05% p.a. for VAS, but a little more for VGS at 0.18%.
The MSCI World ex-Australia benchmark is only developed markets. This means you do not have any exposure to emerging markets, like Taiwan, India, or China.
The MSCI World ex-Australia has a significant share of US equities, at 70%, which has boosted the relative performance over ten years.
Remember, these are the returns in AUD from buying ETF product on the ASX. There has been a common view in the Australian market that foreign exchange risk makes global equity exposure riskier than staying at home. The reverse is true.
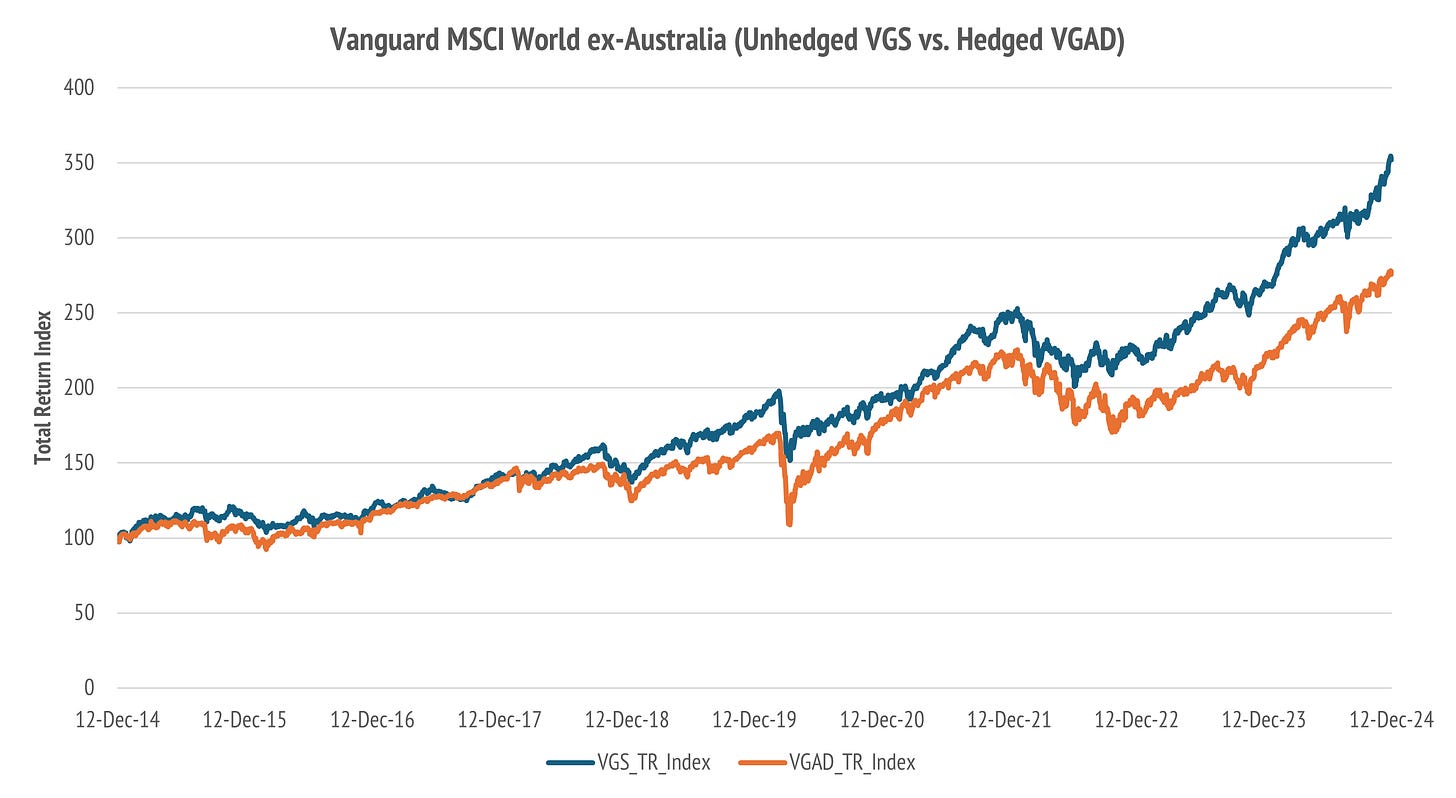
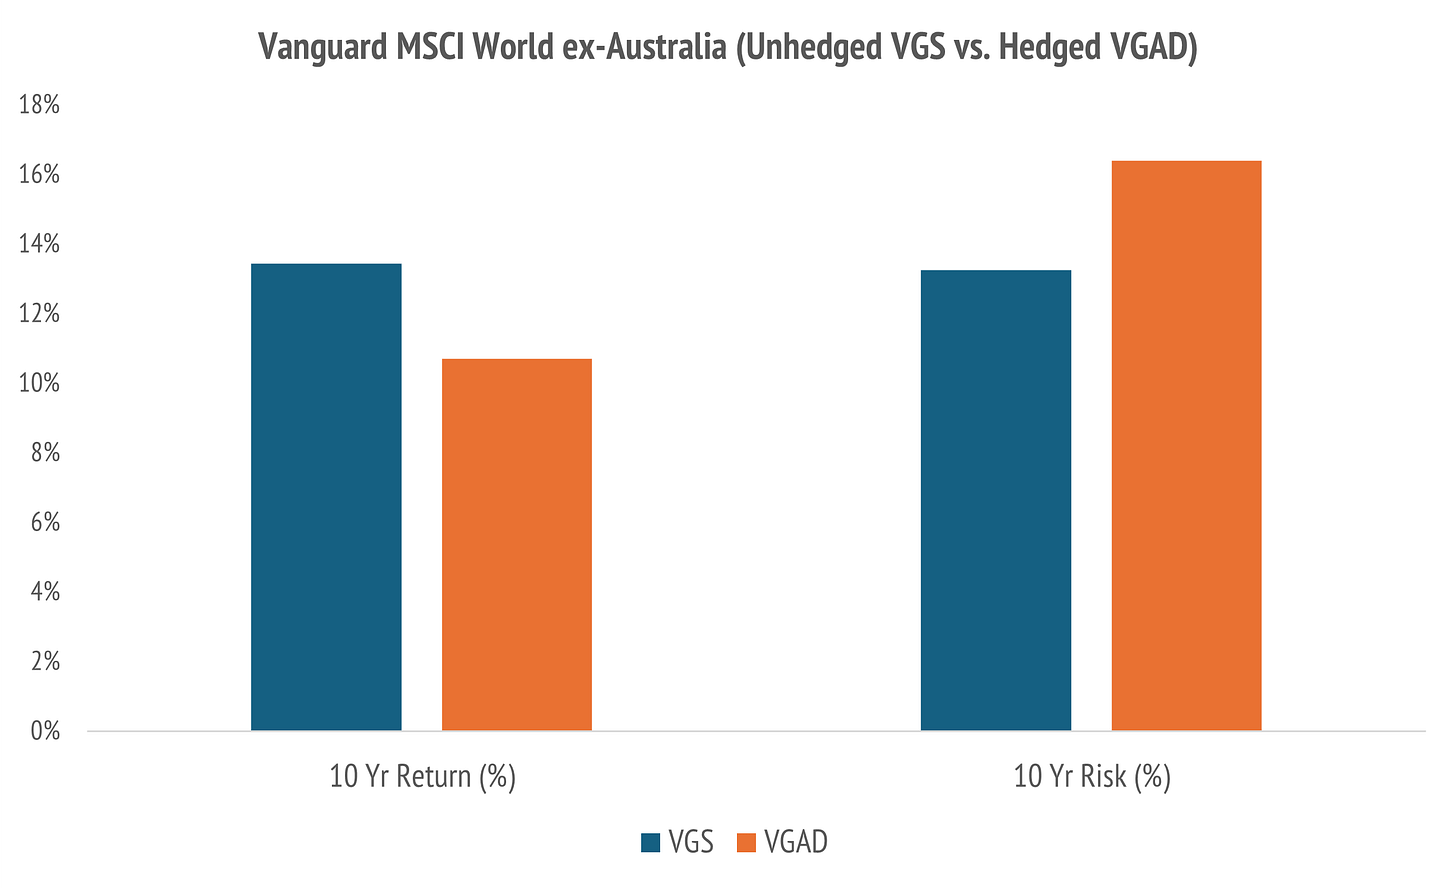
Let us check once more on the effects of hedging. There is a more expensive version of the XASX: VGS ETF which trades under the ticker XASX: VGAD, at 0.21% MER. The benchmark is the MSCI World ex-Australia (Hedged AUD).
The negative effects of hedging are again clear.
Numerically, the effect is less than for the S&P 500.
I have not done the detailed analysis, but I expect this is mostly a USD effect. Recent weightings of the USA in the MSCI World ex-Australia are around 70%. The return premium of the unhedged S&P 500 was about 4%, and 70% of that is 2.8%.
Pay attention to natural hedging in AUDUSD currency exchange rates. Certainly, the AUD can appreciate versus USD, but over the long run our currency has fallen. The productivity performance of the Australian economy has been poor since 2016.
The way Australia pays for lower labor productivity is via a weaker currency.
The Large-Cap World versus Australia
The MSCI World ex-Australia performance is attractive, but perhaps we can do better by focusing on the most successful large companies globally. Recall that we have focused on developed markets so far, which ignores emerging markets.
There are large companies like Taiwan Semiconductor XNAS: TSM, which could easily go into a core global equity exposure. The selection principle at work is success!
Of course, past success is no sure guide to future success.
However, when you buy a passive benchmark there are regular changes to that which throw out failing companies and include new ones over time. You may want to own more of certain companies in a large cap ETF, but you can do that as a satellite.
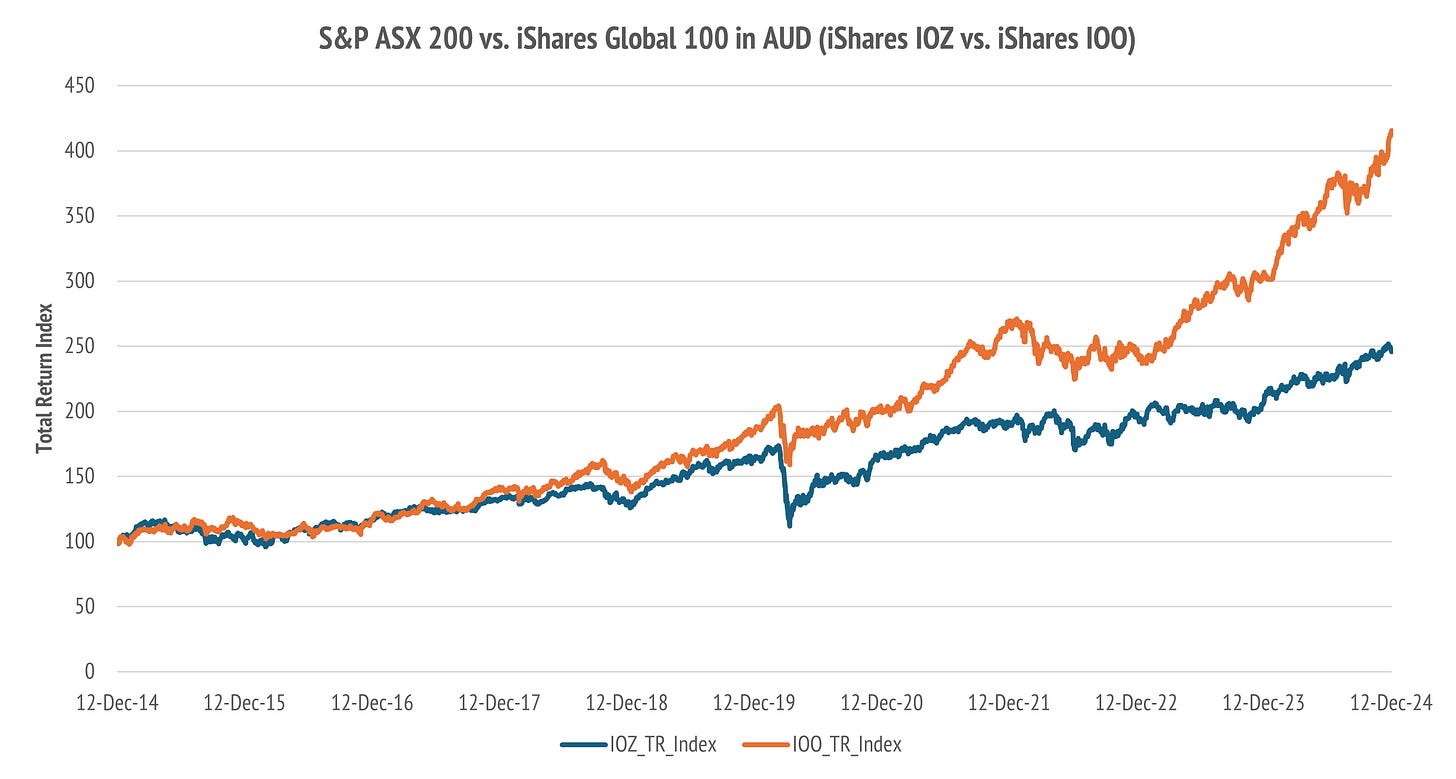
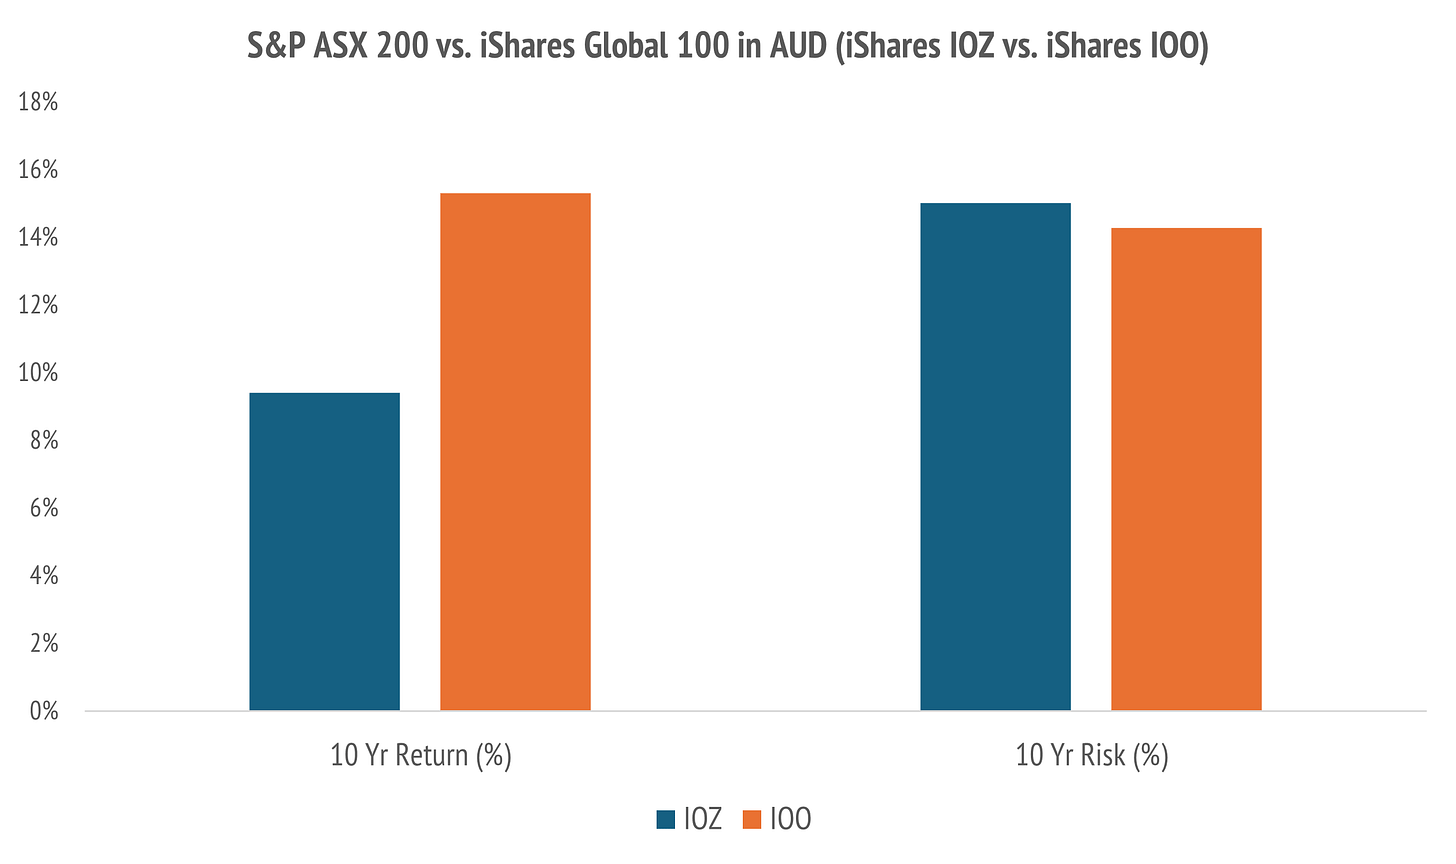
The iShares Global 100 ETF XASX: IOO tracks the S&P Global 100 Index, which has the largest liquid developed and emerging market stocks traded globally. We compare this to the iShares S&P ASX 200, as above. The MER of 100 is 0.40%.
The risk reduction to owning the S&P Global 100 is less than before.
The return premium is still around 4% but the risk reduction is lower.
We should not be surprised that the return from the iShares Global 100 is very nearly the same as the iShares Core S&P 500, since the large cap US stocks dominate in the top ten. The only non-US stock in the top ten is Taiwan-based TSM.
You have to pay more, at 0.40% p.a. than the S&P 500 at 0.04%. However, this does come at the benefit of some global diversification. This is not a bad pairing.
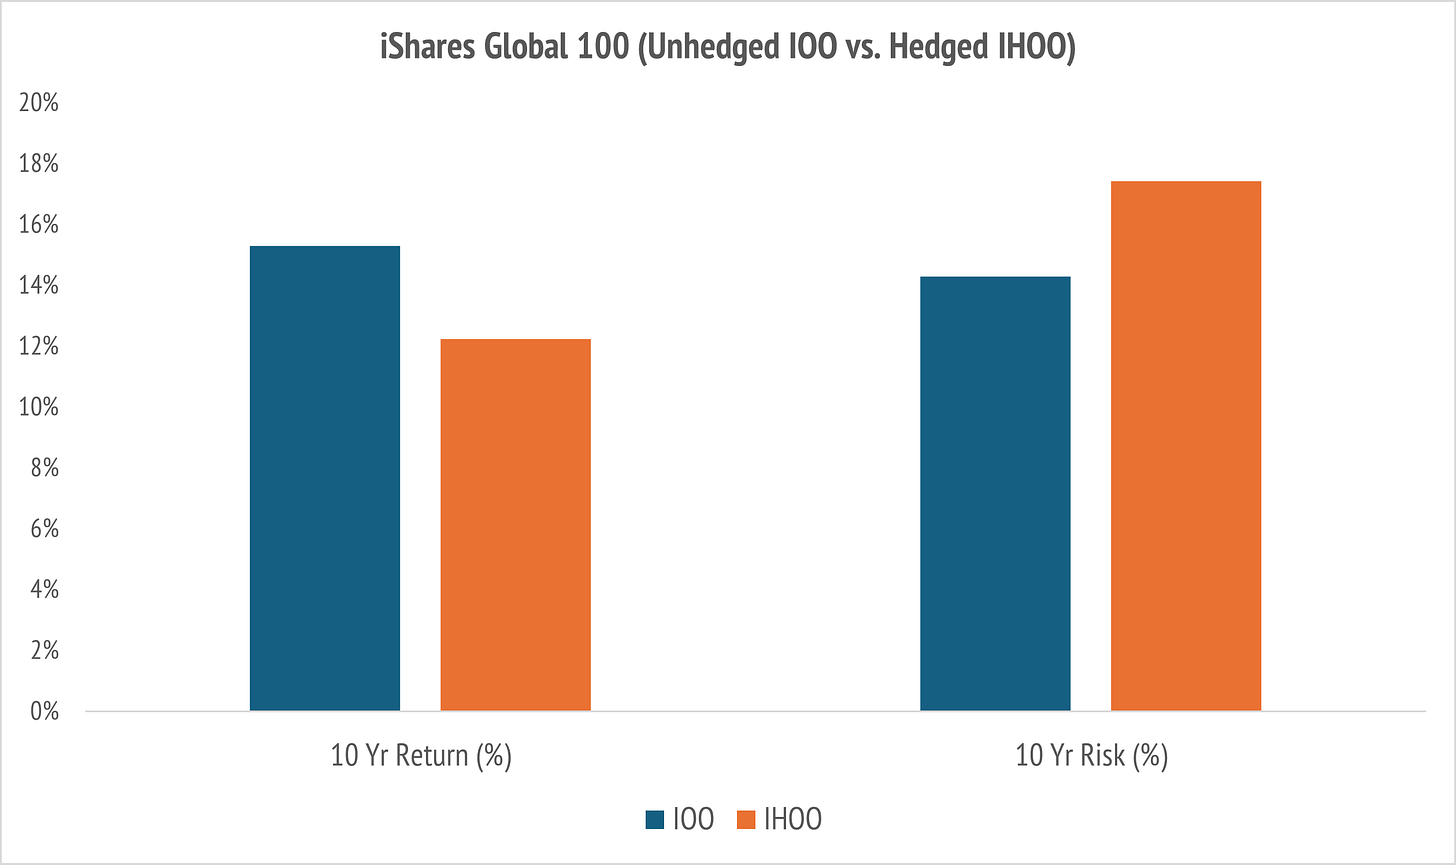
For completeness, we look once again at the hedged version XASX: IHOO which costs a little more at 0.43% p.a. The result of hedging back to AUD is again negative.
The story is the same as before, lower return at higher risk.
The difference in risk and return is less than with the S&P 500 but still significant.
With these facts in mind, we think the iShares S&P Global 100 is a pretty reasonable choice to pair with any S&P ASX 200 ETF for your core equity exposure.
What mix of Australian and Global Equity?
Let us conclude this note with a brief discussion of weightings.
Presently, the USA is a large component of global equity weighting. Twenty years ago, it was around 30%, but US markets exceptionalism has driven it to 70%. Trees do not grow to the sky, and so there is a risk in carrying the USA at a high static weight.
Remember that the attraction of a market cap weighted index is that it naturally adjusts to market changes in the relative size of companies and countries.
For example, you might buy the iShares S&P Global 100 today, but as a buy and hold investor, the future weight of the USA in your holdings will reflect a changing world.
The fact that Taiwan Semiconductor is in the top ten is a reflection of the recent boom in semiconductor stocks globally. Down the track there could be a French luxury firm, like LVMH XPAR: MC entering the top ten. Passive indices change constantly.
When you consider your core holdings, the buy and hold piece, buying shares in the top 100 firms globally makes sense in most periods of economic development.
If the USA gets wiped out by an asteroid, it was a bad call.
However, while equity valuations matter, they can be managed through the rest of your portfolio exposures, both single stocks, but also your defensive assets.
With these observations in mind, let us look at the relative size of your equity exposure to the Australian market, and the Global market in risk terms.
One useful way to simplify matters is to note that the relative risk of markets tends to be more stable than the relative return. Risk is bidirectional, return is directional.
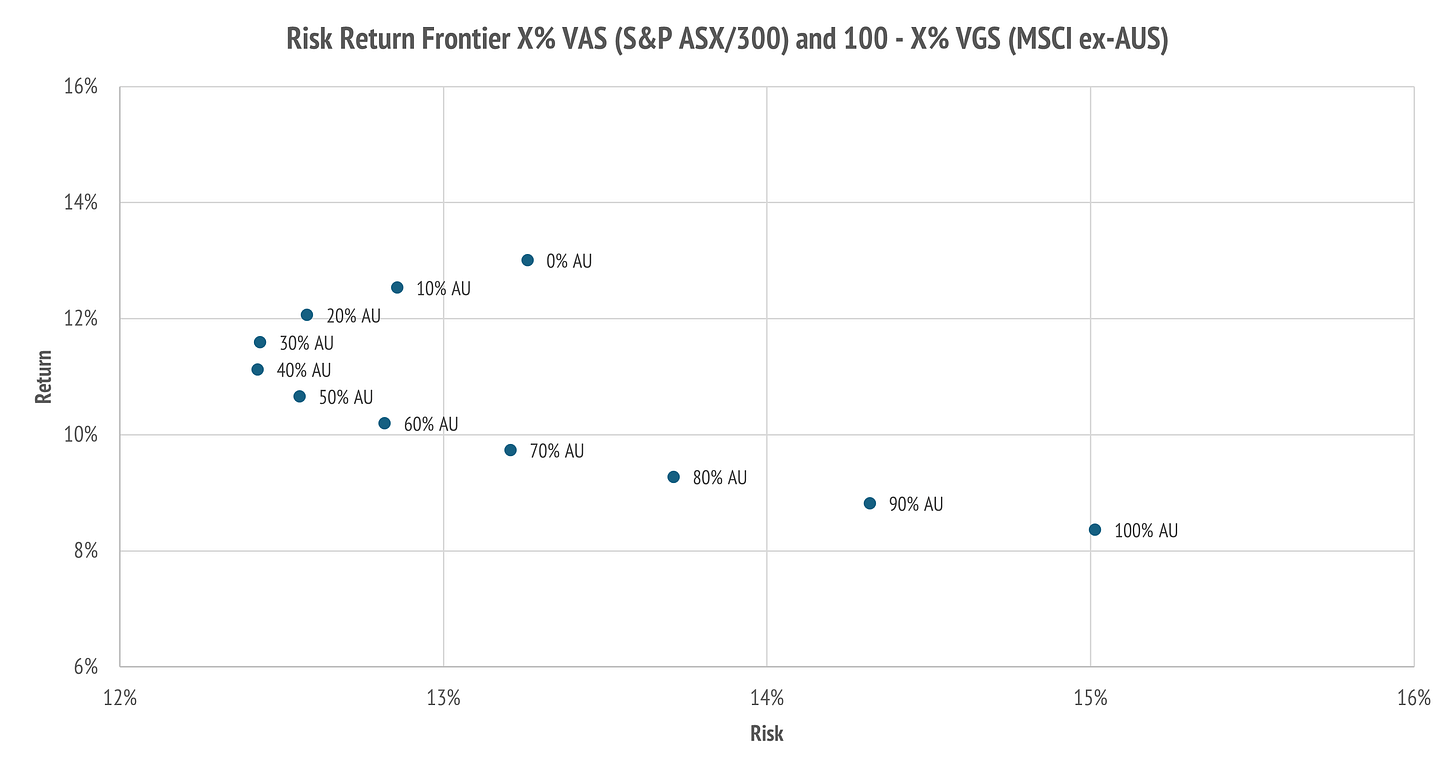
Using first the VAS/VGS pair, which is the lowest cost and most broadly diversified, we can evaluate the daily risk and return from different combinations. You cannot really buy such a portfolio, since you would rebalance daily, but it is a rough guide.
Starting with 100% in Australia, via VAS, we calculate the ten-year realized risk and return, adding in Global, via VGS, in 10% steps until we get to 100% Global.
The result is called a risk-return frontier chart.
The numbers are shown below.
Shooting for the lowest risk option may seem a bit lame, but there are periods in history where the risk premium changes relative sign between markets.
The USA has not always out-performed Australia.
From the above, a portfolio weight of 30-40% in Australia, and 70-60% in Global looks conservative from a risk management standpoint. The total risk of your portfolio can then be managed by splitting this growth allocation, with a defensive piece.
I will discuss this split later but think of holding Y% in cash and 1-Y% in the above 40% Australia and 60% Global equity portfolio. That is a good starting point.
You can always reallocate the Y% cash to include bonds and term deposits.
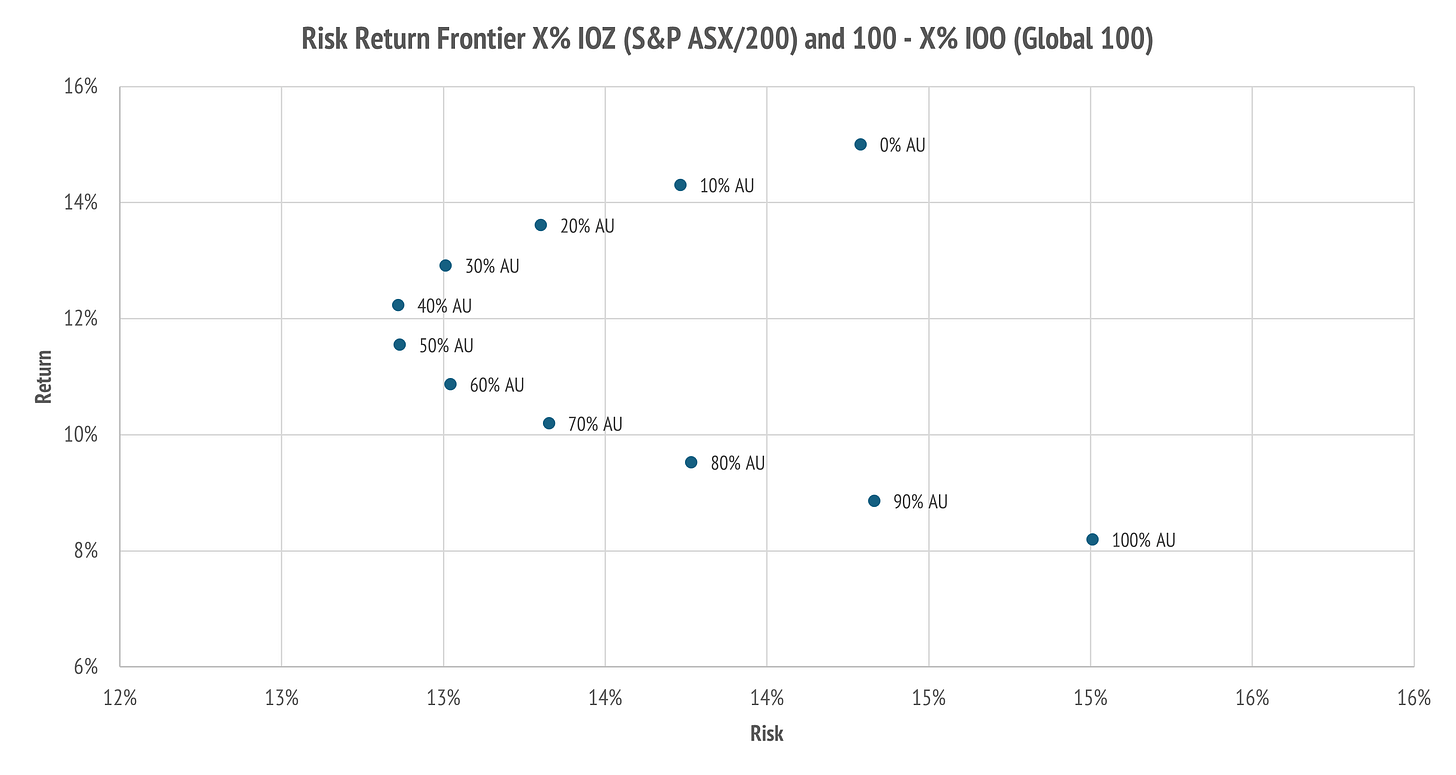
This result is very similar when we look at the more concentrated combination of IOZ which is the S&P ASX 200 and IOO, which is the S&P Global 100.
The numbers are higher in this combination on both risk and return.
You can take your pick between these two different ETF core-equity model portfolios.
This wraps up our introduction to going global with ASX-listed ETF product.
Conclusion
Asset allocation is a complex topic, due to the uncertain nature of future market returns and the sensitivity of portfolio outcomes to your weighting decisions.
This note is designed to demystify the subject of core-versus-satellite investing.
The key takeaway is that you can simplify your portfolio management decisions by consciously choosing to hold some chunk of your assets in low-cost ETF product.
The aim here has been to show that the ASX has a good selection of such products to get you started without having to open a foreign brokerage account.
I will continue this theme over the holiday season by elaborating on the defensive part of your portfolio, where hedged ETF products do make sense, and on using thematic ETF product for adding some spice at the margin.
Eventually, we will build to a portfolio that has single stocks as well.
This is how I run my own Self-Managed Superannuation Fund (SMSF).
Happy holiday season and best wishes for a prosperous New Year!


