Key test of confidence for FMG and MIN
The transition from a bear market to a bull market is not always smooth. In this stack, I dissect a divergence in sentiment between iron ore majors.
As I explained in the introductory note Enter the Yabby... Our Origin Story, I developed the cost-basis indicator for market sentiment analysis as a method to help navigate changes in market conditions, particularly moves to and from a bear market.
In this free post, I illustrate just why I pay attention to this indicator.
From time to time, there are critical trading sessions.
These happen when the usual voting machine of market sentiment gets silenced by the weighing machine of fundamental value.
I will illustrate with Fortescue XASX: FMG and Mineral Resources XASX: MIN.
The Savvy Yabby Indicator in a nutshell
Recall from my earlier posts here, and elsewhere, the Savvy Yabby Indicator (SYI) is a simple moving average indicator, as used in technical analysis, which has the speed determined by the rate at which investors trade their holdings.
There have been such variable speed indicators before.
What makes this one special is the choice of recipe for the moving average length.
For the SYI we set this by a simple formula for the turnover rate in stocks.
Other things being equal, higher turnover days will lead to a faster moving average according to the standard update rule for an exponential moving average.
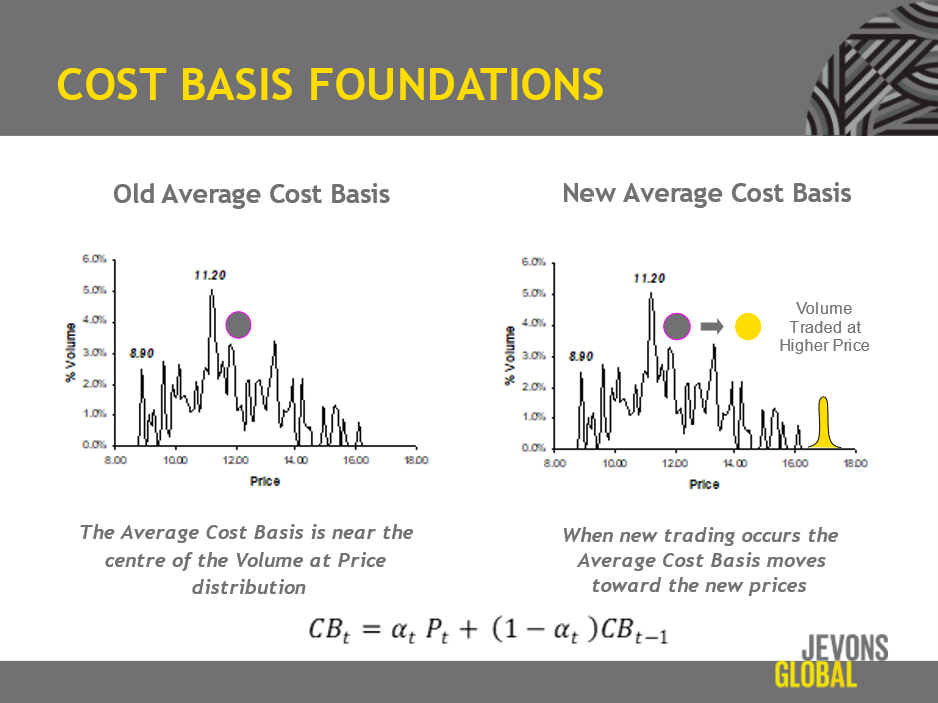
In words, the cost basis indicator is updated by taking the percentage of shares outstanding that were traded in the last session, multiplying that by the price, and then adding that to one minus that percentage for the old cost basis.
The entire reason for this is help us estimate the average price at which current investors will have bought their stock, as illustrated below.
Since all investors now holding the stock bought at some price in the past, the only values possible are the past traded prices. The proportion of shares outstanding purchased at past prices is proportional to traded volume.
Since shares change hands all the time we must adjust for market memory loss.
The older a trade, in time, the more likely that some shares that were bought then will have changed hands, with the original cost of entry lost. The memory loss effect can be estimated by assuming that the any prior holding is equally likely to be traded.
This is an assumption, to make the estimate possible, but it seems to work.
Interpretation of the SYI signal
The level of the moving average is an estimate of the average cost of entry for those investors who still own a stock. Therefore, we can reason out the interpretation.
If the current price is above the cost basis bullish sentiment prevails.
If the current price is below the cost basis bearish sentiment prevails.
One critical moment in the life of stocks is when we hit the break-even line.
If you reflect on the reasoning behind this indicator, that point where the stock had reached break-even, on average, represents balanced sentiment.
Normally, investors will be eager to buy more of stocks that go up because they go up and to sell those who go down because they go down.
In stock markets, this is known as momentum.
While following the price trend is generally a good strategy, it fails when the market hits extremes of valuation. The darling stock that can do no wrong will fade once it gets too expensive. The detested stock that can do no right will rally once all weak hands are out, the valuation is good, and the fundamentals are improving.
When you are right at cost-basis break-even the sentiment factor is neutral.
These are special times where the fundamentals loom large.
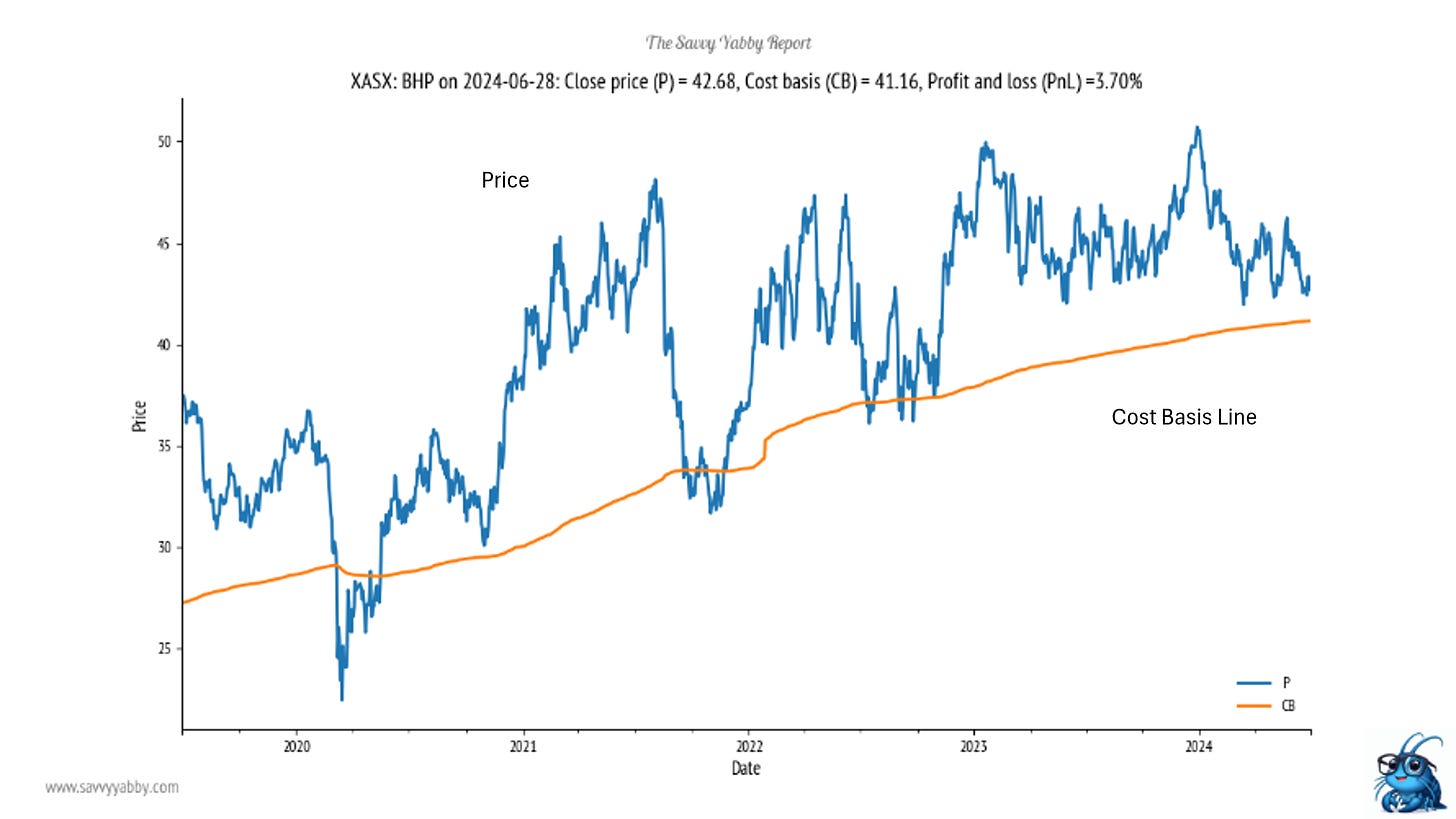
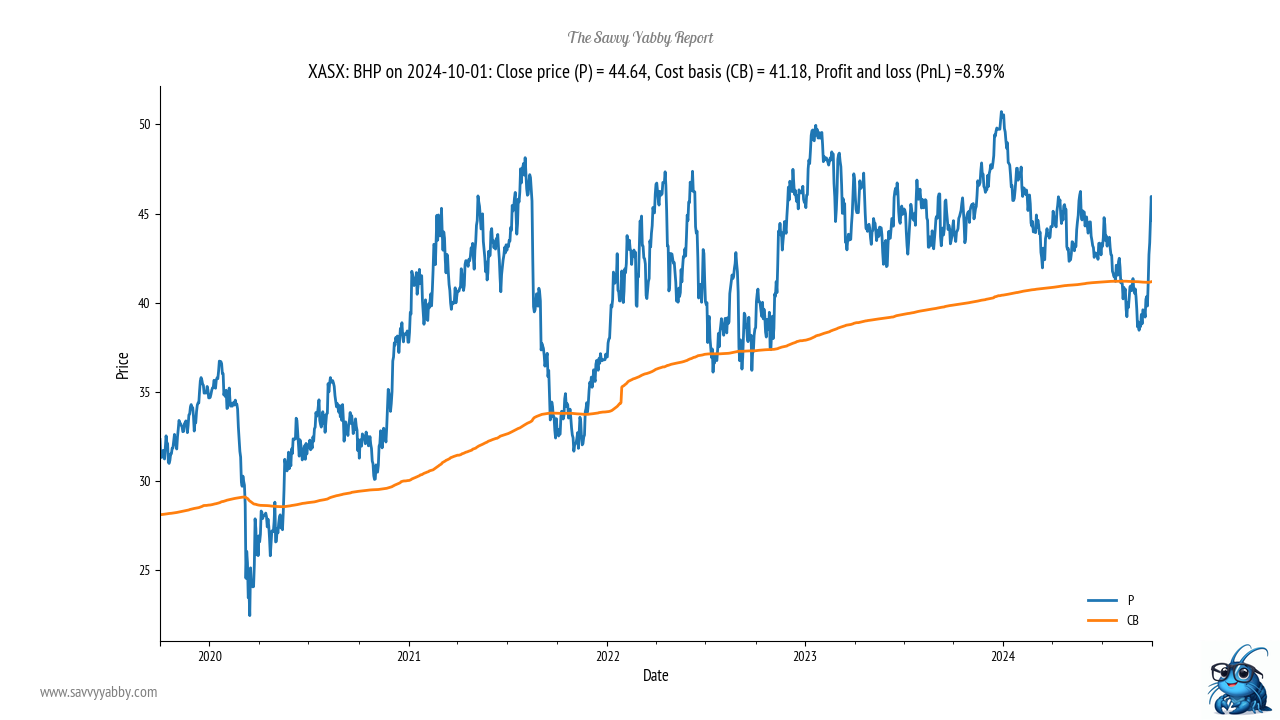
You can see this with an example for BHP Group XASX: BHP.
Notice how the price of BHP navigated those times close to break even. It went into a deep but short bear market in the COVIS period, and shorter ones thereafter.
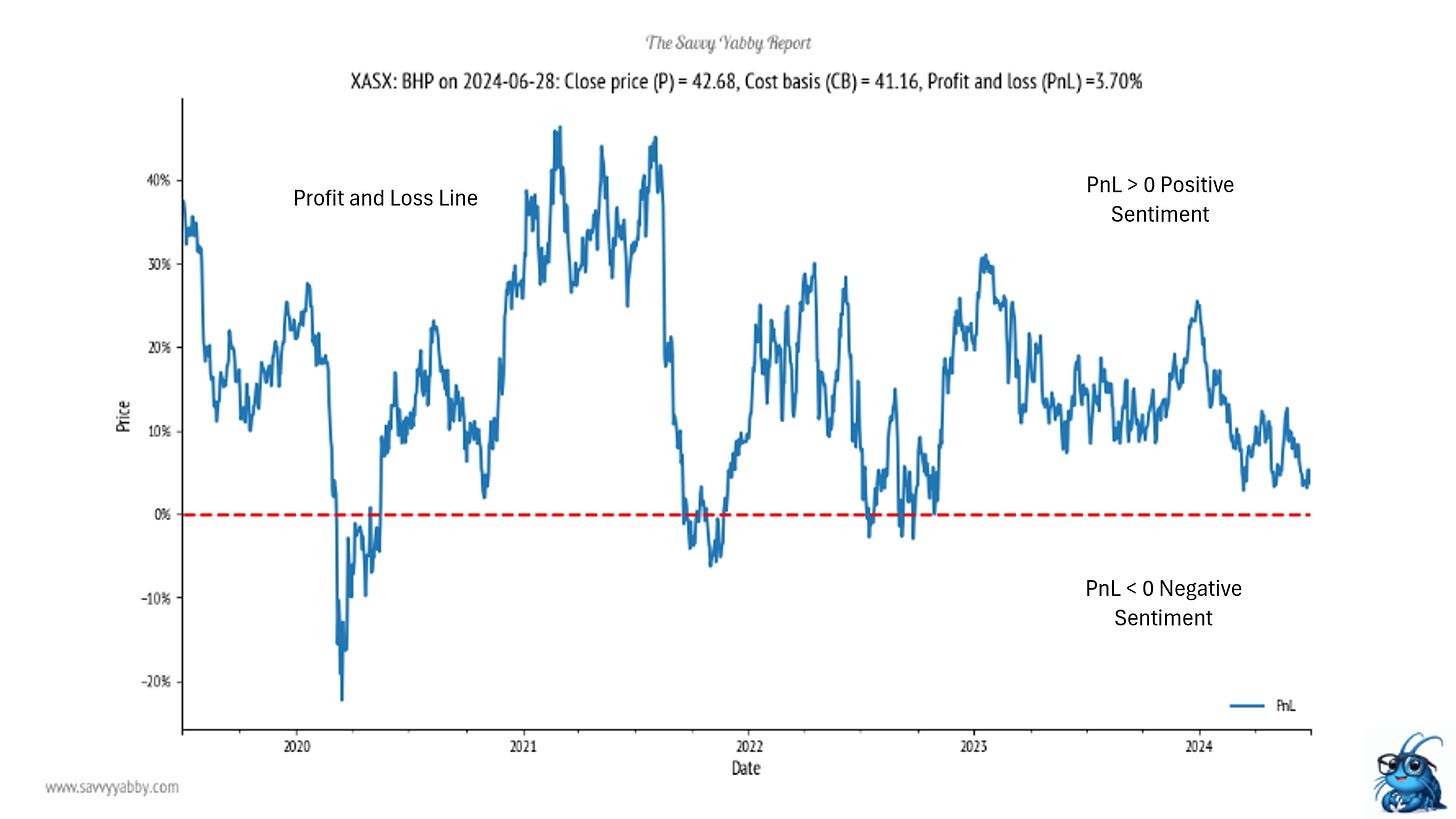
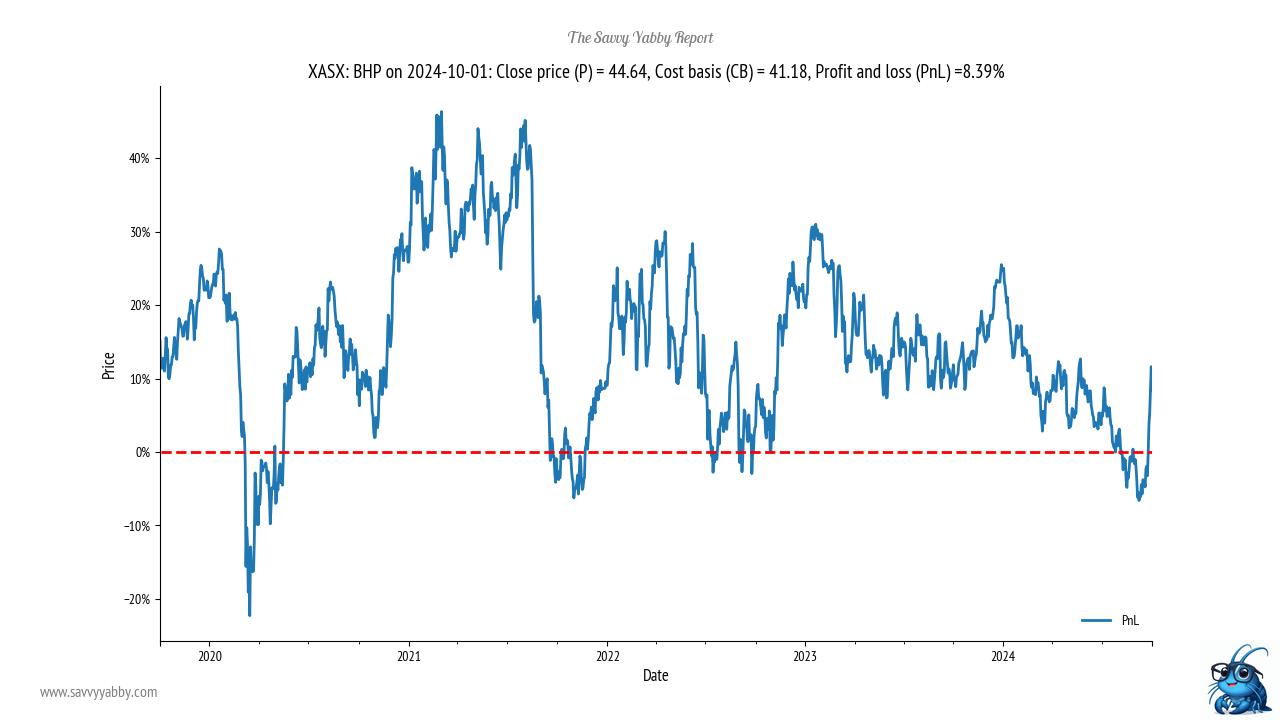
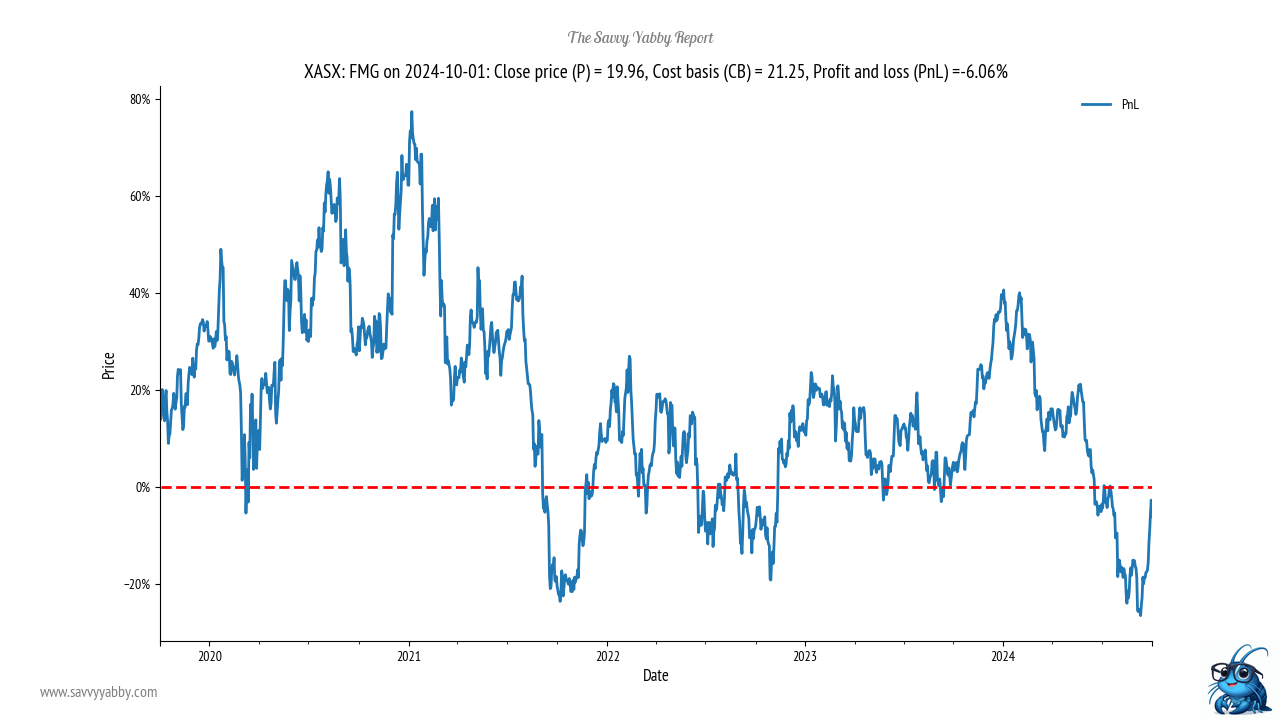
For ease of analysis, I also look at a profit-and-loss chart using the ratio of the current price to cost basis just as an investor would when reviewing their broker statement.
When you look at many examples of such charts, over many stocks, and many periods you start to notice a few things which stand as general principles.
Stocks typically turn within plus or minus 5% of cost basis
Investors are often eager to take profits in the 10-20% zone
Selling often dries up when unrealized losses hit -40% but can continue
There is no sure thing in markets, but if you examine charts that I share with you, and you consider the prevailing fundamentals, you can supplement your own thinking by reflecting on where other investors sit, and how they are likely thinking.
Let us apply this now to the recent rally in iron ore majors.
The sentiment divergence in iron ore stocks
Remember that the SYI signal is no sure thing, but it is an estimate of how well or poorly the current investors in a stock are doing, by unrealized profit.
In deep bear markets, most investors are nursing positions in a deep loss, while the opposite is true in raging bull markets. The transition is where headlines change.
Consider this fact considering the charts I now present and your newspaper reading.
The super-majors are doing just fine
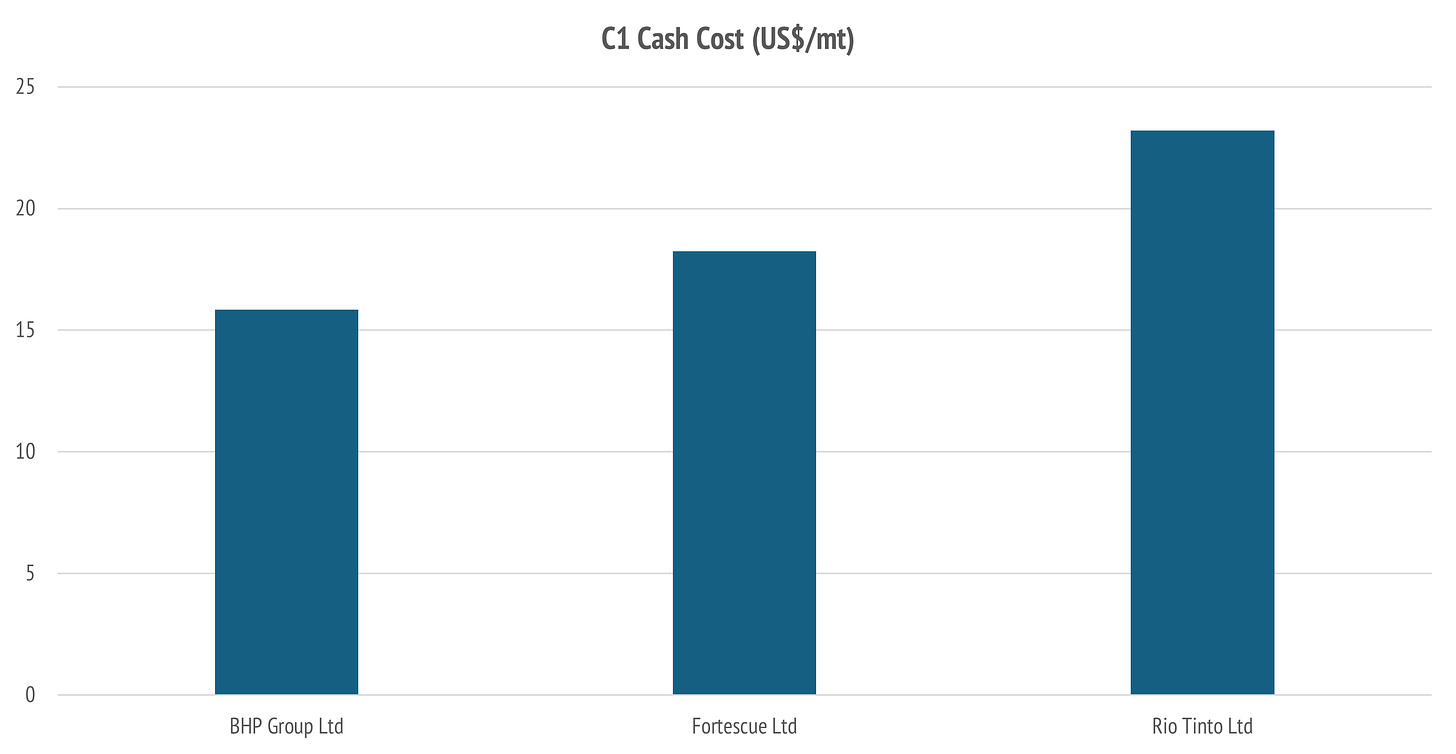
In a previous note, I included this C1 cash cost chart.
The restoration of sentiment is clear in cost-leader BHP Group XASX: BHP.
The unrealized profit and loss has nudged up towards the 10-30% profit taking zone.
The stock is likely a little overbought now, but the bear market looks to be over.
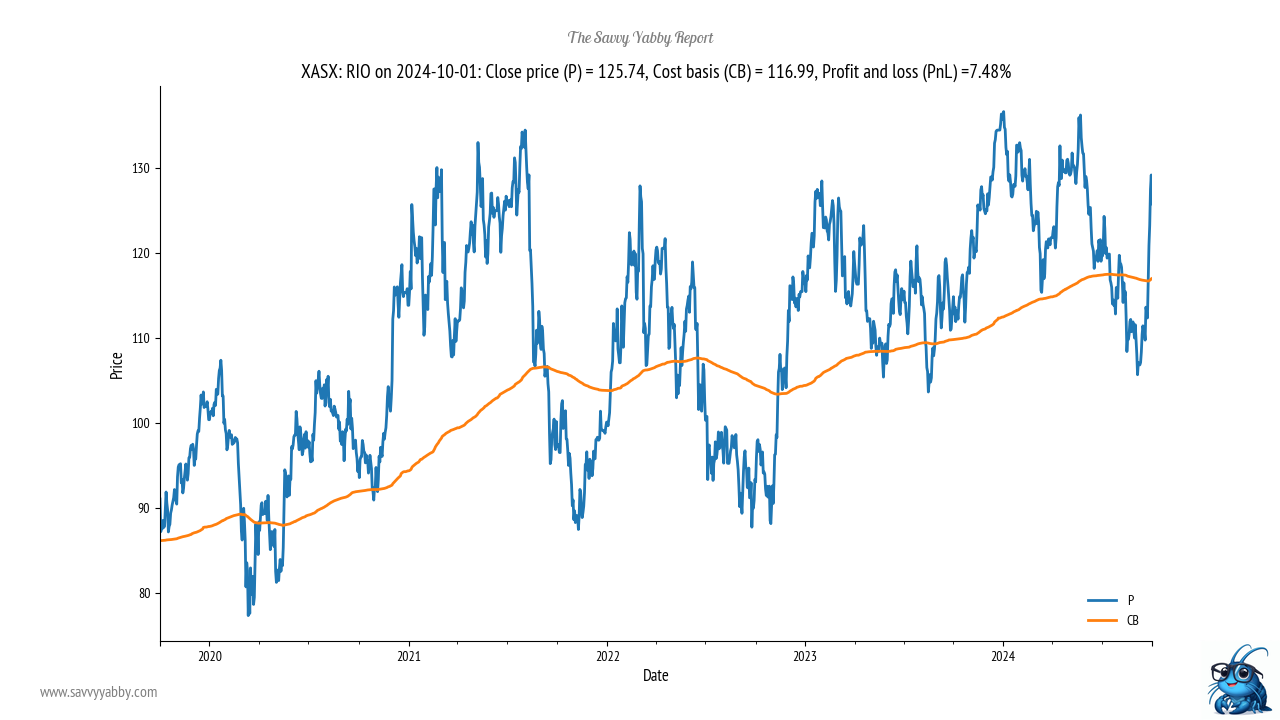
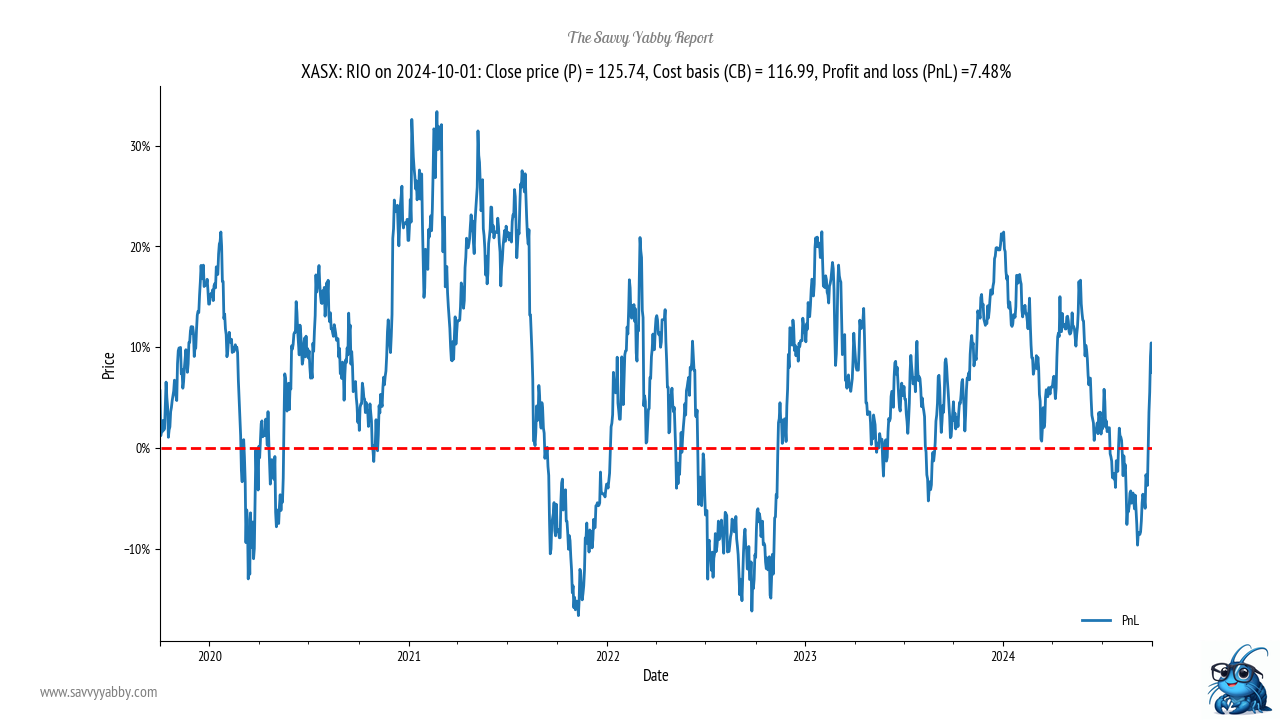
The story for Rio Tinto XASX: RIO is similar.
The profit and loss chart suggest we will likely consolidate from here.
The value of such sentiment analysis is to help set the scene for a discriminative analysis of which stocks in iron ore are out of danger and which are not.
The test of sentiment in Fortescue
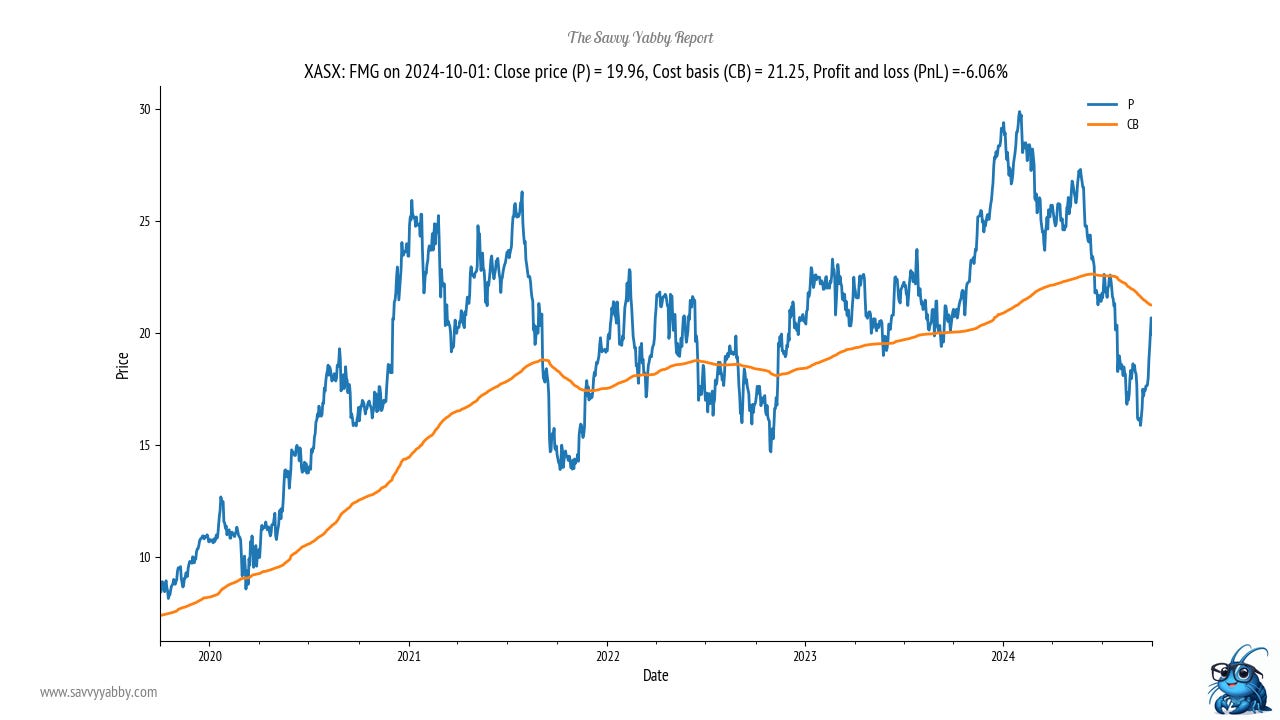
In the C1 cash cost chart, Fortescue XASX: FMG is between BHP and RIO. However, as you can see below the bear market in this name started earlier and was deeper.
Of course, the use of past tense may be inappropriate.
It is not unusual, in a sectoral bear market, for some stocks to emerge more quickly and confidently than others. BHP and RIO seem to be in the clear.
Watch Fortescue this week to see if we can hold and break through $21.25.
It is an important test of market confidence.
The test of sentiment in Mineral Resources
I did not include Mineral Resources XSAX: MIN in the C1 chart, due to this being a moving target with new operations, and their lithium exposure.
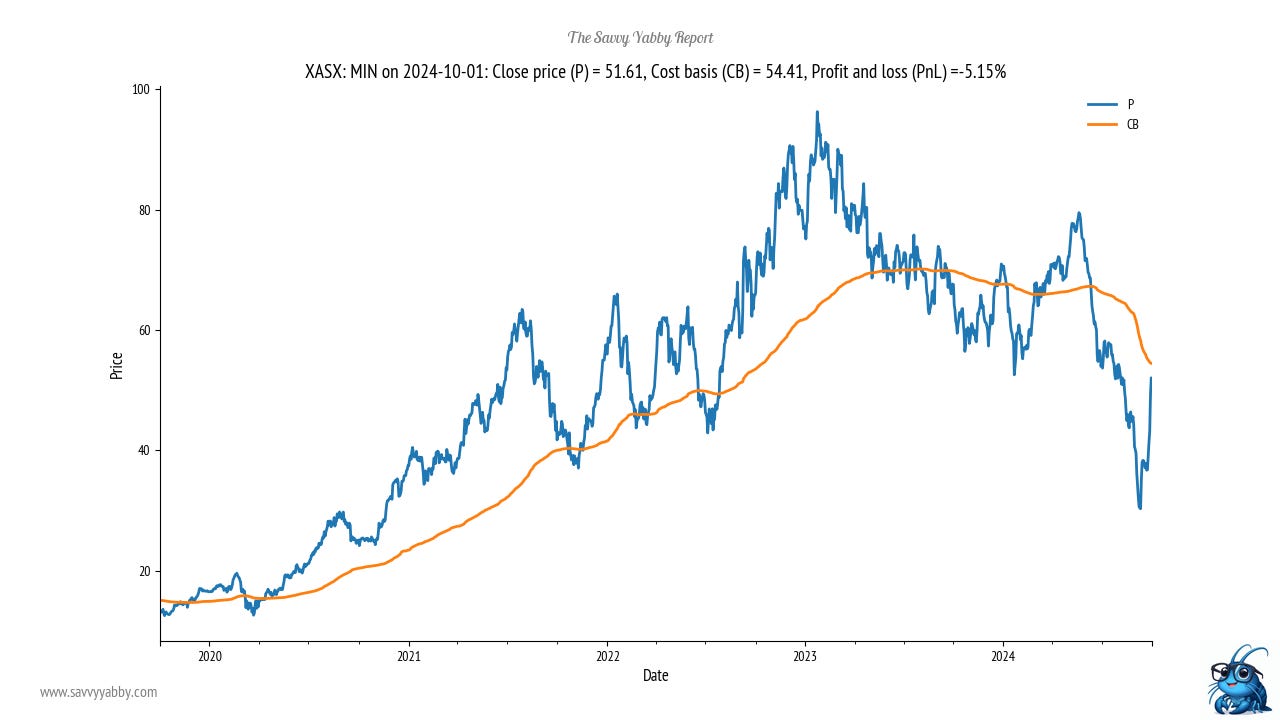
However, you can see that the bear market has been much deeper.
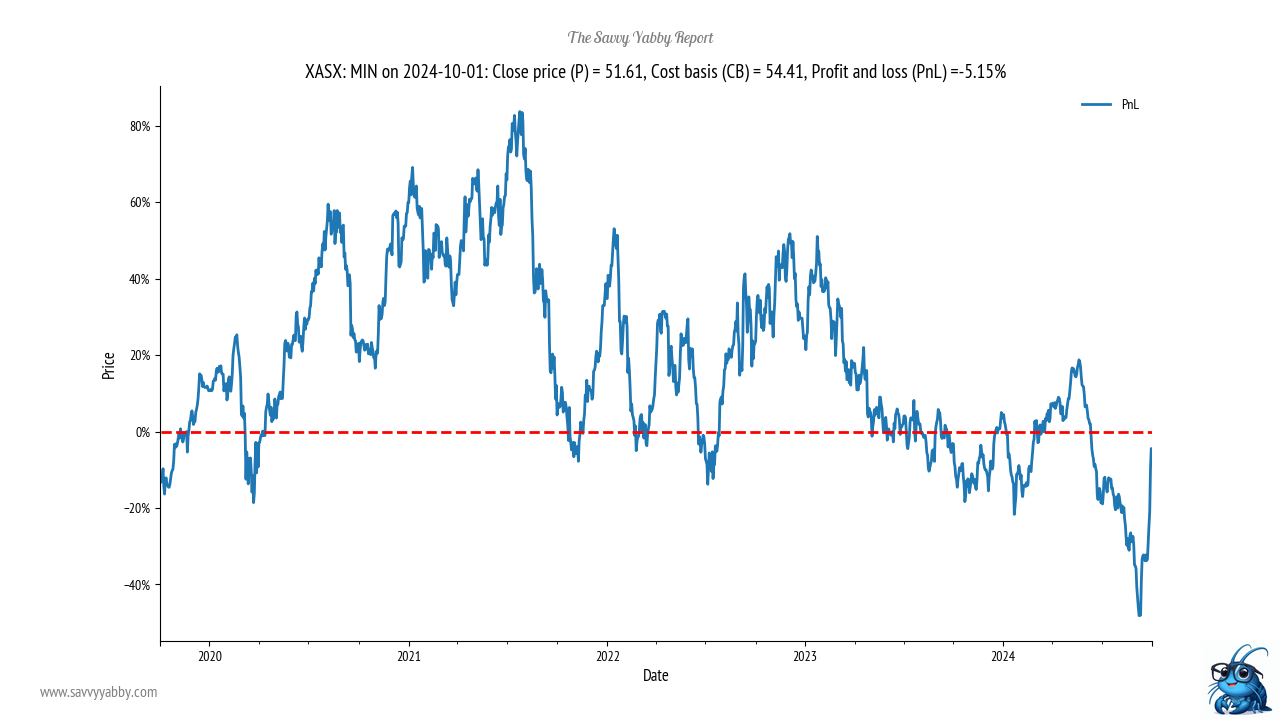
The profit and loss chart shows a much deeper drawdown for investors.
Like Fortescue, the next few sessions for Mineral Resources are critical.
The break-even level is around $54.41. Investors who are made whole on their holding after having nursed deep paper losses may come out in force to sell.
Mineral Resources has been the subject of negative speculation over the strength of their balance sheet. They made several early-stage lithium investments towards the peak of the market and are looking to raise cash from selling rail interests.
This is the stock I am most nervous about.
I think it could fail at these levels, with another leg down.
Conclusion
This note is really a tutorial to help readers identify when the Savvy Yabby Indicator can be of most value, and how I apply it to my reasoning.
I do not apply this method in isolation of any consideration of fundamentals.
However, I find cost basis analysis useful when a bull market is first developing, which is when a current bear market is ending.
The pace and sequence of advance from bear market lows is often peculiar to the stock and the psychology of its investor base.
Those who look for quick profits and losses in sharply moving stocks have a marked tendency to clutch at profits or losses in a more vigorous fashion.
Given the above analysis, I would say BHP and RIO are safely out of their bear market but will likely advance in stodgy fashion from here. Fortescue has a big test coming but remains profitable, which is a marked positive.
Mineral Resources looks to be that stock at most risk from a second leg down.
Good luck with navigating the next week, as this iron ore market settles.


