Resources under heavy tax-loss selling
This tax-loss selling season has seen critical minerals under pressure
In a previous post, we introduced our regular cost-basis investor sentiment tool.
This measures the degree to which investors are likely wearing unrealized losses in their positions. This depresses sentiment and can lead to significant bear trends in both stocks and sectors, depending on how widespread the losses are.
Here I update the screen from last week to capture market movement.
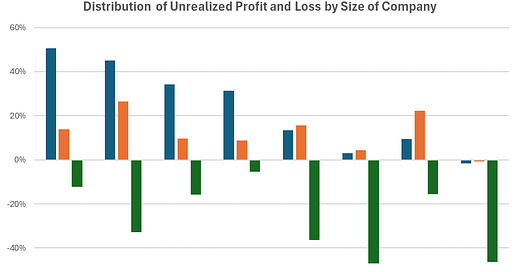
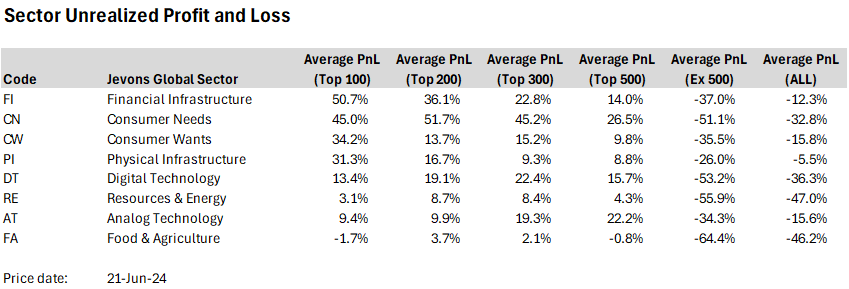
The headline for this tax loss selling season is weakness across small caps. The effect is particularly noticeable in small-cap resources, as shown below.
The sectors shown are those we use at my firm and listed out below.
These are super-sectors designed to capture the basic wants-versus-needs and physical versus non-physical dimensions of the economy.
Analog Technology is the opposite of Digital Technology, in that it is material, like industrial equipment.
Food & Agriculture includes the farm to fork aspects of the food chain, from agricultural operations through food processing to supermarkets.
Physical Infrastructure relates to the built environment, and includes Real Estate along with utilities, airports, rail, road, and ports infrastructure.
Consumer Needs is necessities like health care, other than food.
Consumer Wants are the more cyclical consumer companies.
The top twenty screen is here.
The paid version of this post has the full allocation of stocks by sector, along with our latest estimates of the cost-basis. These have been updated since last week and now use IPO prices for the cost basis starting point, where available.
Keep reading with a 7-day free trial
Subscribe to The Savvy Yabby Report to keep reading this post and get 7 days of free access to the full post archives.


