Following my previous post The Tao of the Savvy Yabby, I present our chart pack.
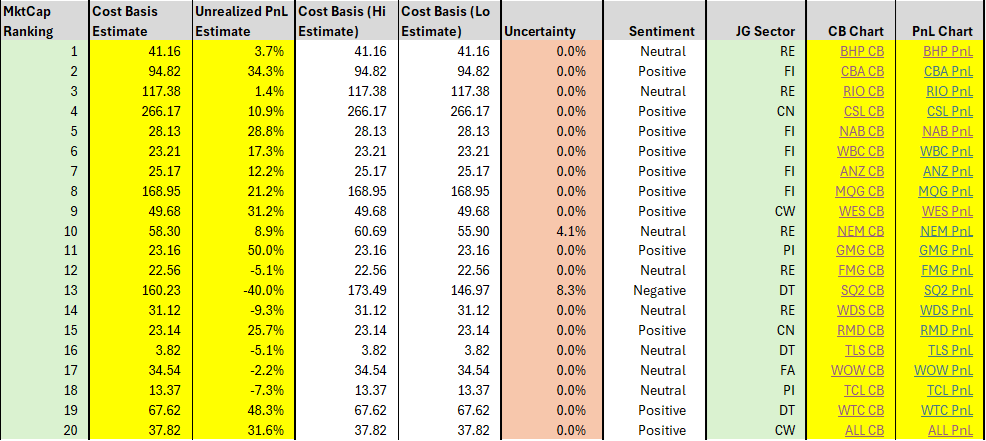
The free version of the screen contains the twenty largest stocks.
This is just the spreadsheet, if you want a small download and no charts.
Now comes the tricky part…
Substack does not let me put compressed ZIP files into a post.
However, it does let me put CBZ, the comic book format into the post.
Now comes some Yabby Foo for you.
Feeling brave? Download the CBZ file, which is really a ZIP file with the extension changed. This is a hack I found on this Substack post. It turns out that Substack supports CBZ files, which are really ZIP files. Go figure.
For this to work, you will need to rename the extension to “.ZIP” from “.CBZ”. There are tutorials online for Windows, and also for Mac. For reference, I scanned both versions of the file, the ZIP, and the CBZ, with Windows Defender. All okay.
Sorry about this kludge, but Substack supports Comic Books and not Zip files.
If Substack complains to me, you downloaded a comic book.
Once you get through this nonsense, you will see for yourself.
It has pictures in it.
You have subscribed to a market comic book, don’t you know :-)
Unzip the file and you will find a spreadsheet and directory with charts.
There are hotlinks in the spreadsheet to open the charts.
You can see these in the far right-hand column of the screening tool.
Just click on the “CB” link for cost-basis and the “PnL” link for profit and loss.
The full ASX market is available for paying subscribers below the pay wall at bottom.
Here are just a few highlights.
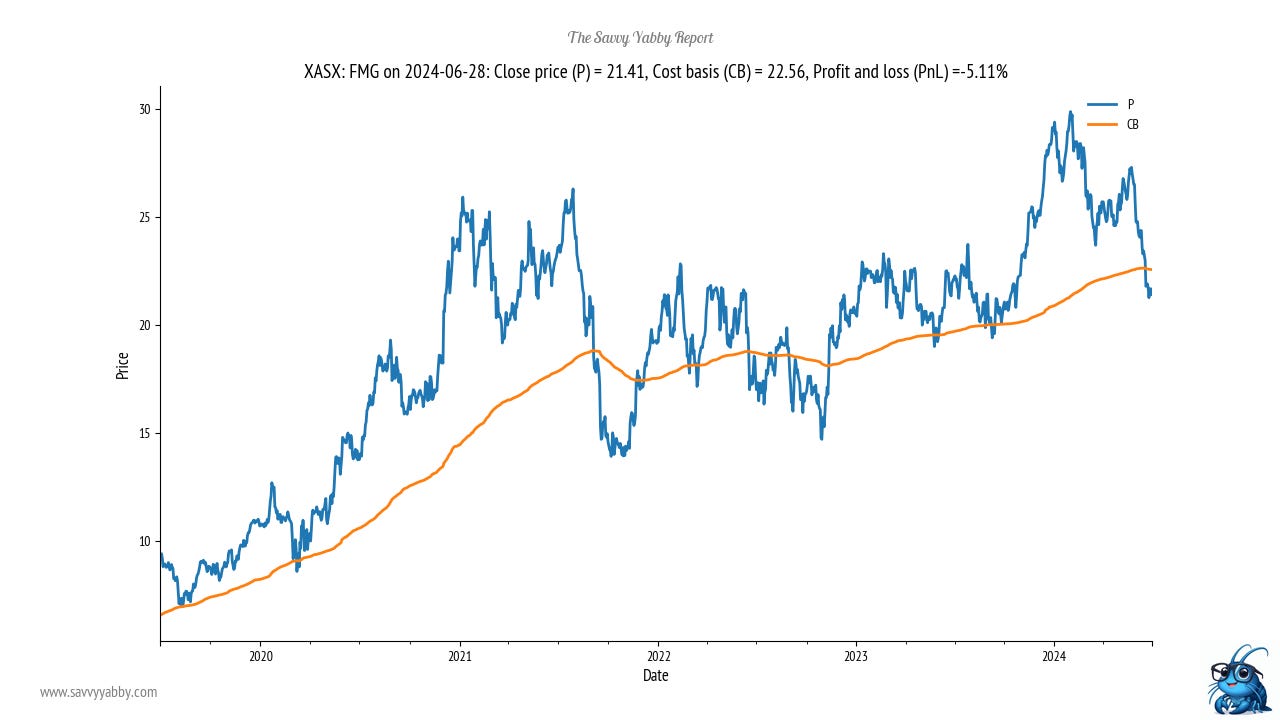
Fortescue Metals Group ASX: FMG has dipped into bear territory. Look for whether the stock recovers above $22.56 in the first few weeks of the new financial year.
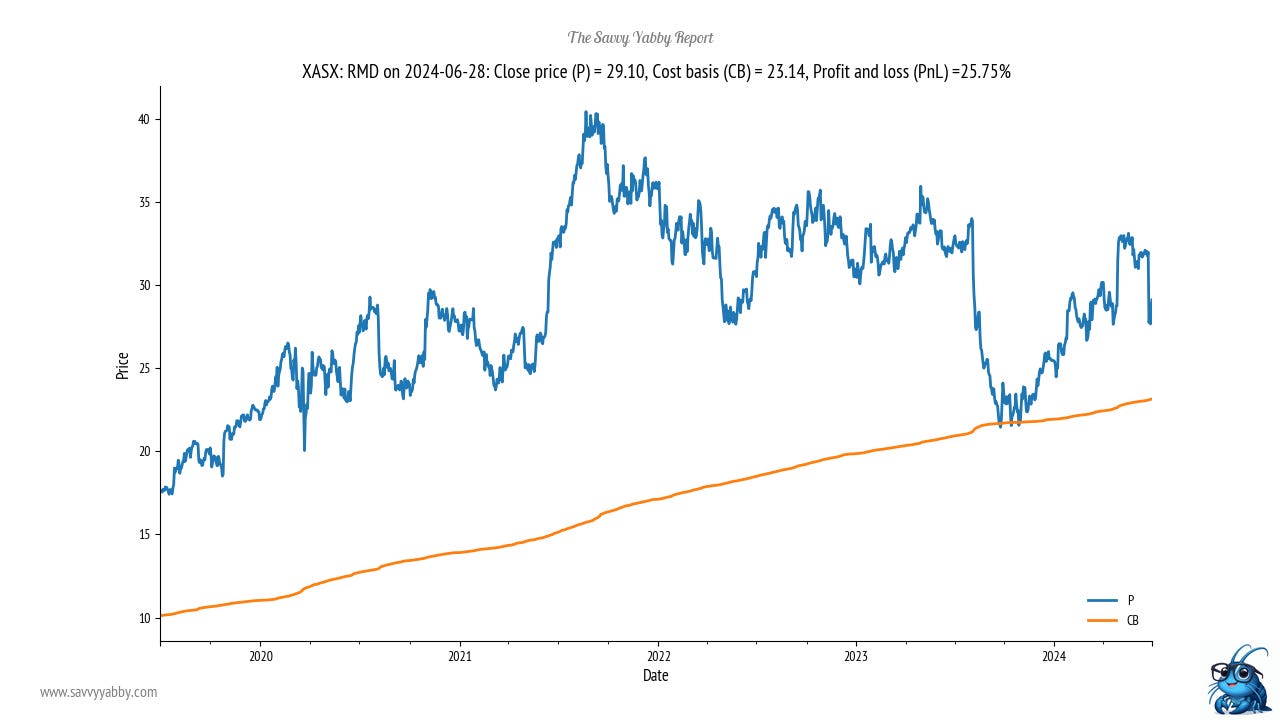
Resmed ASX: RMD had a big test of cost basis late last year during the Ozempic scare that weight loss drugs might cruel the Sleep Apnea devices market. That fear has now resurfaced, but the cost basis support level is now higher at $23.14.
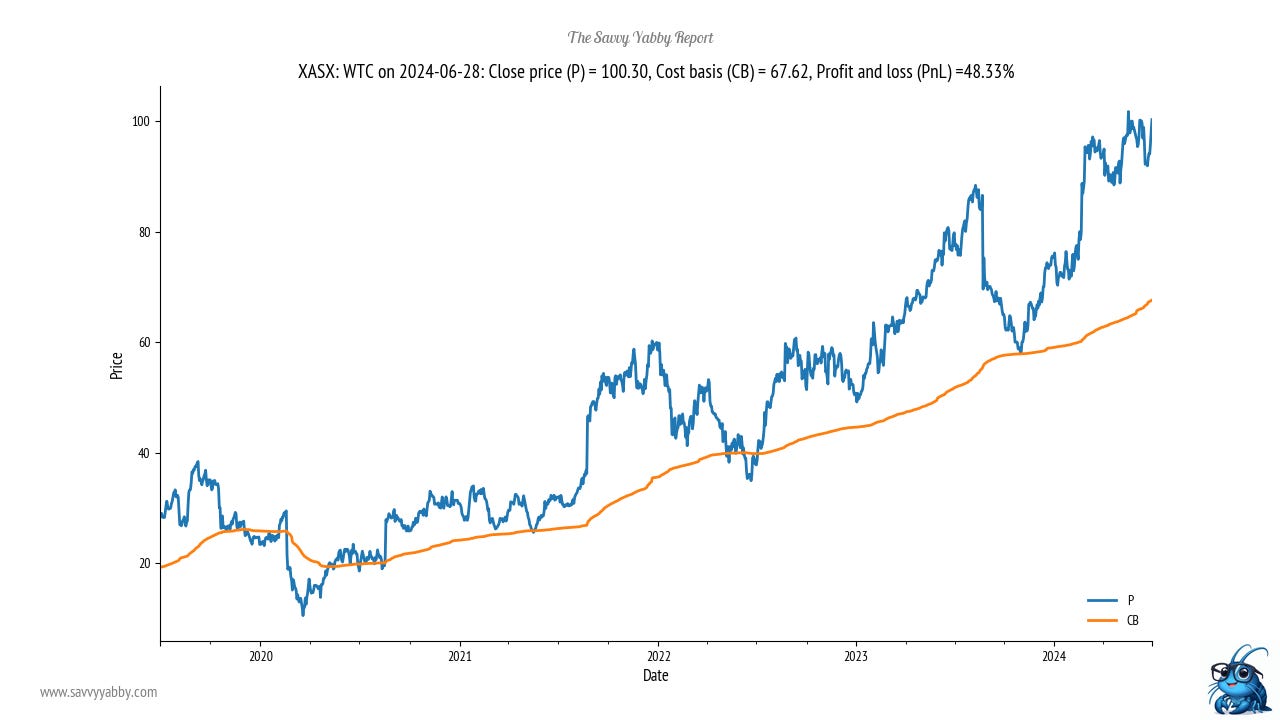
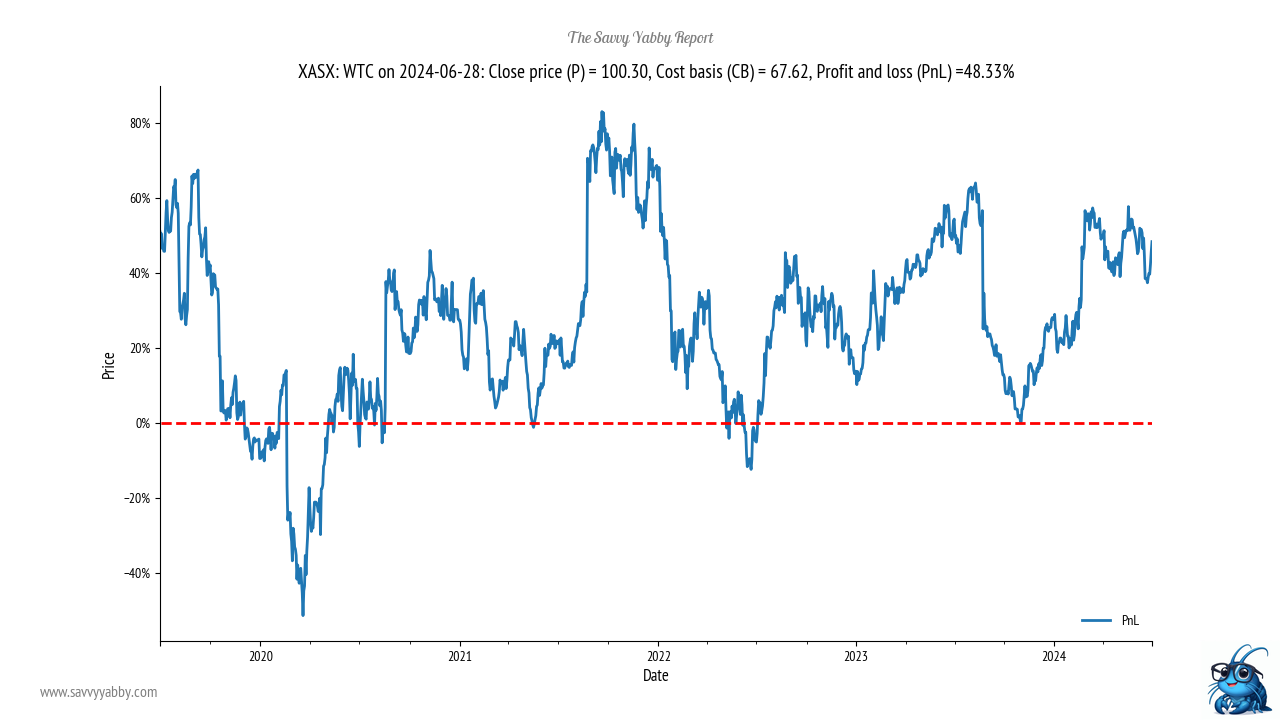
Wisetech Global ASX: WTC had a sharp test of cost basis support in late 2023 and has now fully recovered. The stock looks set to make new highs, although it may be a bit overbought at this time. This is a good candidate for watching the PnL signal.
Notice that investors have typically taken profits at around the 60% unrealized gain level. Watch how this develops to see if there is an opportunity on a pullback.
This could happen if the stock fails to make new highs.
Explanation of the charts
The Savvy Yabby Indicator is designed to help you identify the individual bull and bear market patterns for stocks across the market. We do this by estimating the unrealized profits and losses that investors have on their stock positions.
Note that this is different from the company profitability.
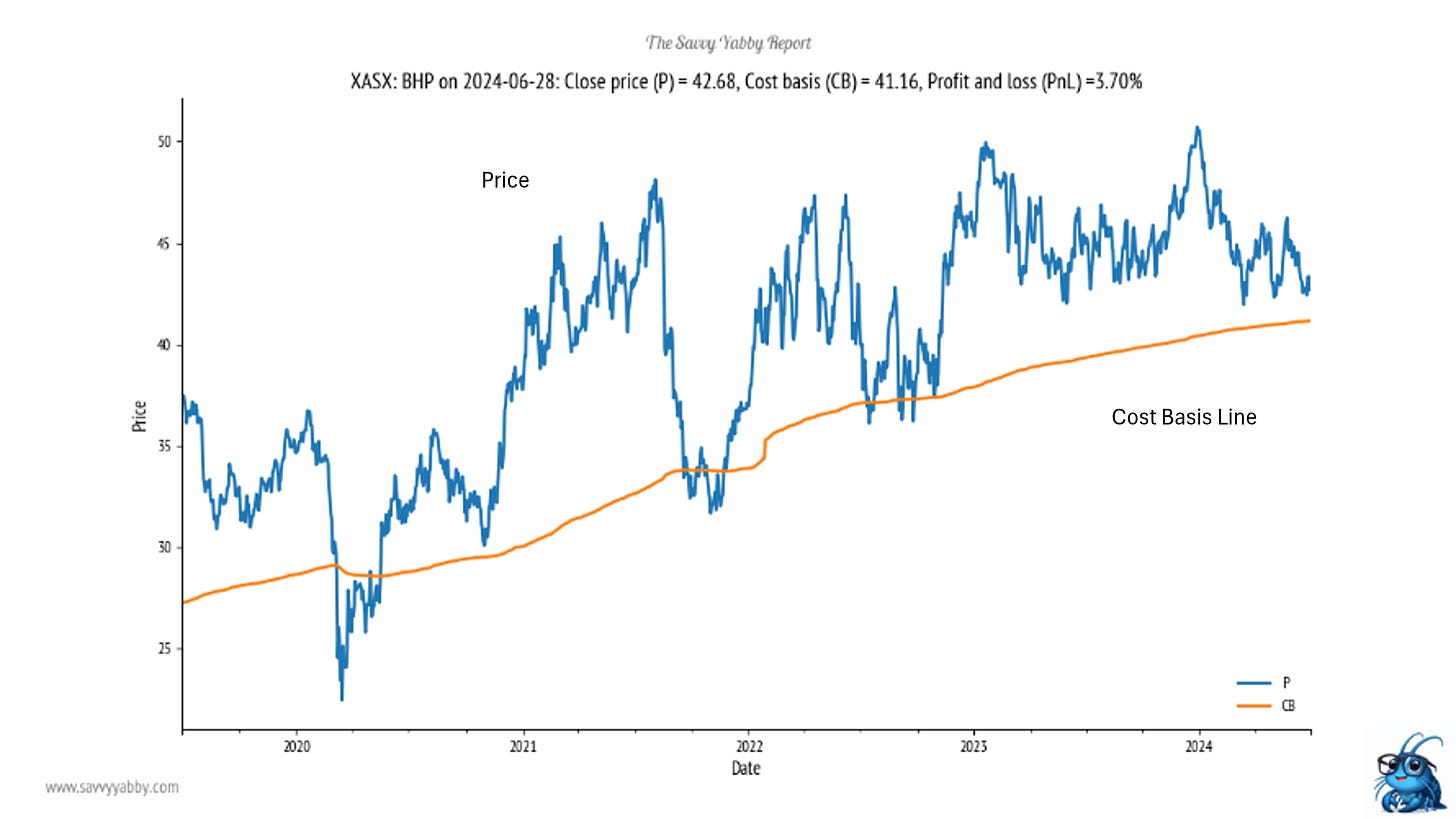
You can see an example above.
The blue line is the traded price for BHP Group ASX: BHP.
The orange line is the estimated average investor cost of entry for their holdings.
The cost basis line adjusts with new trade according to how much was traded.
It is a slow-moving average for low turnover periods and a fast-moving average for high turnover periods. The cost basis will always move towards the current price. It gets higher in bull markets and lower in bear markets.
You can see a minor, and short bear market for BHP around the COVID sell off.
It is easily possible to have a profitable company, with increasing earnings, whose stock is in a bear market, defined by investor losses in their stock holdings.
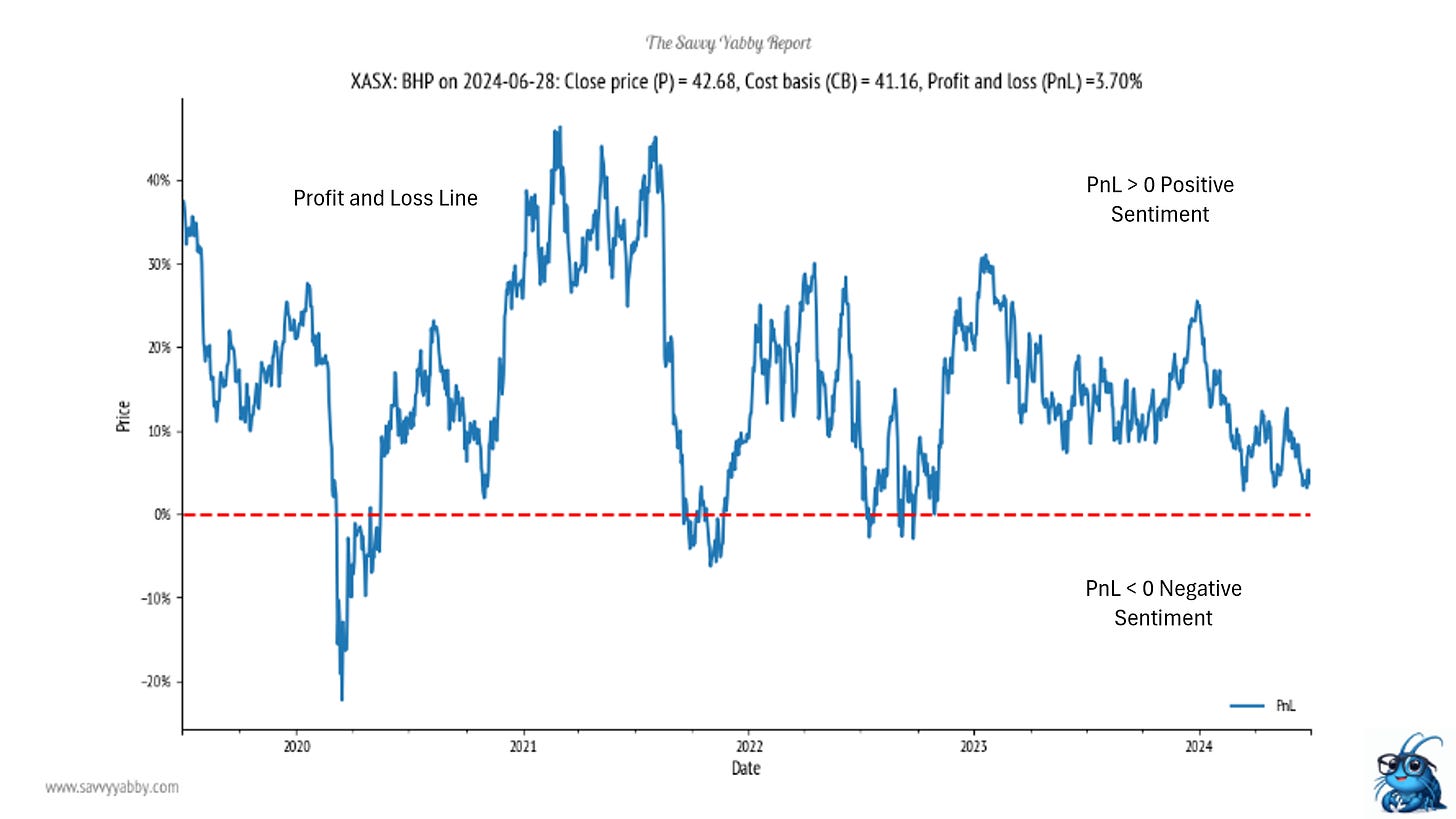
Above we show a “profit and loss” chart, which measures the percentage unrealized gains or losses of investors in their stock holdings. This is an estimate obtained by dividing the current price by the average investor cost-basis.
The zero line, or break even, is shown in red. This acts as support in bull markets and resistance in bear markets. You can see how BHP bounced off this several times.
Note that the current reading is weakly positive. The stock looks set for a rebound at a small margin above the cost basis. Watch how it develops in the new financial year.
The fundamentals of investor sentiment
For simplicity, we can identify two distinct kinds of fundamentals at work in markets.
There is the traditional value, as represented by the company fundamentals. This can be readily understood by looking up the company profit and loss statement.
Then we have yabby value, which is the level at which investors typically bought.
Obviously, if investors paid too much for their stock, so that yabby value is higher than fundamental value, then the stock will likely revert to value by falling.
This process equalizes the market over time.
We can call the relation between current price and yabby value, or cost basis, as the fundamentals of sentiment. This hidden dimension of valuation, relating to what investors would regard as their “break even” has not been widely acknowledged.
If you spend some time examining the charts in our chart pack, you will begin to notice some regularities to investor behaviour.
Investors typically buy stocks which fall to cost basis from above.
Investors typically sell stocks which rise to cost basis from below.
Episodes which break this rule, where there is crossover from one side to the other, on a sustained basis, mark the passage of a bull market to a bear market, and vice versa.
When a substantial portion of the market is in unrealized gain or loss you get an overall bull market, or an overall bear market.
If you look at the charts in our pack, you can see this happening during COVID. The sharp period of negative sentiment passed when stocks rallied to break even.
Note that the entry to a general bear market, where most stocks trade below their average cost basis happens rather suddenly, generally within days.
However, the recovery from bear markets is less synchronized.
Stocks typically recover from a deep bear market at different times.
This seems to be a constant of investor psychology. It is something that I have seen happen regularly over the past twenty-two years that I have followed this indicator.
Now comes some seriously intrepid secret yabby business.
Limbo down under the paywall and snag the full ASX Market Comic Book ;-)
Nudge, nudge. Wink, wink.
Keep reading with a 7-day free trial
Subscribe to The Savvy Yabby Report to keep reading this post and get 7 days of free access to the full post archives.


