The little blue crustacean is twenty-two years old this year.
You may wonder why it took so long to get online :-)
It is not just that the Savvy Yabby is smart phone challenged. There is a problem with delivering any kind of chart-based content at scale. Here is a good chart system:
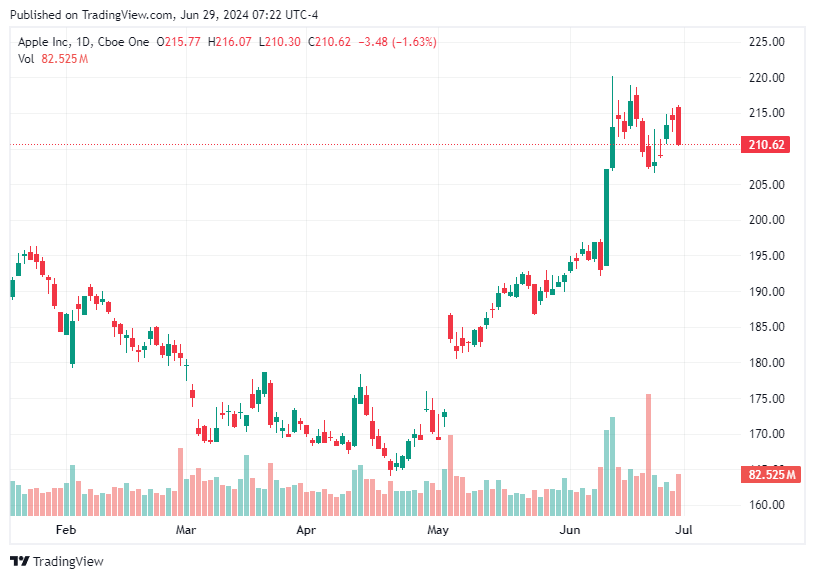
Producing an entirely separate real-time charting system for investor profit-and-loss sentiment, is not a great idea. There are plenty of such systems available, many of which are free, and supported by advertising, or other means.
The problem is when the indicator you want is not in your chart system.
This is chicken and egg. For it to be there, you need to know you want it :-)
In this post, I present my workaround solution.
It is a chart-pack you can use and refer to alongside other market systems.
Why market sentiment matters
The goal of this service is to help investors improve their investment results through a better understanding of market dynamics, particularly the confounding crosscurrents created by changing market sentiment. This has a huge effect on outcomes.
The Savvy Yabby Indicator is designed to help you navigate contrarian waters.
We all know that sometimes stocks are oversold, and that selling begets further selling. When everyone seems to be losing money, everything looks bad.
However, it can be very hard to act when bargains appear before us.
To find gold at the bottom of a river in a raging current is a hard ask.
The problem is the waves of emotion that wash over us.
As with all things in life, the key is not to banish emotion, but to detach from the pain of feeling anguish, loss and disappointment. Emotion is our friend when it guides us towards an acknowledgment that something needs to change in our lives.
Generally, we feel pain and concern, over life decisions, when the matter of dealing fully with them has been shelved. We can easily retreat into denial, and the feeling that forces outside of our control conspire against us.
However, for questions of investment, the life-changing decisions are most often of two basic varieties. There is the happy circumstance when everything is going great, perhaps too great, and we neglect to notice the winds of change. The second is the flip side of this, where we have clung too long to a losing proposition.
In a sea of market noise, our market sentiment indicator speaks a simple truth.
When everyone is euphoric with profit, they are likely too optimistic.
This condition leads investors to become over extended and prone to losses.
The converse is also true.
When everyone is miserable over losses, they are likely too pessimistic.
The fundamentals of profit and loss for the company are quite different from those of investors in the securities of that company.
Money can be made in loss-making firms.
Money can be lost in profit-making firms.
The transmission mechanism of a financial market does not directly reward forecasts of fundamental progress for any company, in the short run. Recall this saying:
“In the short run, the market is a voting machine, but in the long run, it is a weighing machine.”
- Benjamin Graham
This is apropos of the essential problem, and the reason why I developed the Savvy Yabby indicator. There are many methods to measure the fundamental value of any company, and we think it is essential to consider these. However, there is no known means to measure and weigh the madness of crowds. Isaac Newton once said:
“I can calculate the movement of the stars, but not the madness of men.”
- Isaac Newton
He said that because lost a lot of money riding the great South Sea Bubble.
In an early post, Enter the Yabby… I recalled my own experience with losses.
Investor euphoria is a dangerous condition, as is widespread investor despair.
Financial markets excel at producing such conditions, as the mood of the vocal crowd is pushed first one way and then the next by their fortune or misfortune.
This is the human condition, and we are all caught up in it, most of the time.
What is incredibly hard is to stand apart from the crowd, to absorb what is being said, and the stories being told, but to look upon them dispassionately.
I do not mean judgmentally.
We are social animals, and the human race would not be where it is today if we were ever and always wrong in our enthusiasm or optimism for all things new.
However, we are also prone to get caught up in mass movements and manias.
The dispassionate attitude I am speaking of requires empathy, an ability to feel what the crowd is feeling, but not to succumb to the view that we must feel the same way.
When we can observe accurately what a crowd is feeling, through understanding the primary sources of emotion in markets, namely fear and greed, then we can begin to detach from becoming caught up in slavishly imitating those feelings.
Great investor opportunity arises at extremes.
Contrarian investors, who are successful, are not those people who habitually do the opposite of their peers. Rather, they know when it is prudent to act differently.
In many ways, raw intelligence is not the key requirement for investing.
The key is to know that a crowd that is wrong is an emotional crowd.
Crowds can be as right as they are wrong, but when they are wrong, in the kind of way that makes for great opportunity, it is usually because collective emotion has overcome rational thinking. This is where you find great value opportunities.
How empathic understanding can help
Empathy is the ability to understand and share the feelings, thoughts, and experiences of another person. This is a detached feeling, in kind. We may not directly experience the same emotions, but we are sensitive to their presence and effects.
We all experience this when counselling others on their worldly troubles.
When you are not directly experiencing those emotions, but share an understanding of their reality and significance, it becomes easier to reason about them.
In life, we are often at sea with our own troubles, and look for the counsel of others.
This is wise when good confidants understand us, as friends, and are also sufficiently detached from the immediate circumstances to offer helpful suggestions.
Reason and emotion are partners in effective decision making.
Emotion and feelings of impending danger warn us when something is wrong.
Reason and detachment from the emotion can help us plan solutions.
I developed the Savvy Yabby sentiment indicator once I understood that I had been foiled by my own attachment to reason, reasons to hold an investment that did not make any sense. The fear of admitting we are wrong can often lead to bad calls.
Equally, the feeling of being incapacitated by mounting losses can easily lead anyone to freeze. Naturally, we choose paralysis over forthright action.
The key to breaking this cycle of indecision is emotional intelligence.
When saying this, I do not simply mean our interpersonal relations. The financial market is an emotional beast, but it is not a person. It is a crowd.
Emotional intelligence, when applied to crowds, involves understanding what ails the crowd, what motivates the crowd, what drives the crowd.
This is hard in most every sphere of life except finance.
Fortunately, what drives a crowd in finance is base emotion: fear and greed.
To measure this, the Savvy Yabby indicator estimates investor unrealized profits.
When these are high, the crowd is ecstatic and prepared to bet on winners.
When these are low, or wildly negative, the crowd is miserable.
Feel the market pulse. Understand not just what the crowd thinks but also what it feels. Emotional awareness guides your decisions.
This is the Tao of the Savvy Yabby.
What market sentiment can do for you
Empathy is a wonderful thing in human relations. It cements our relationships, guides the upbringing of our children, and, with good leadership, can forge national purpose.
Consider this simple proposition:
How could knowing the mind of the crowd help my decision making?
This is not the same as knowing what the crowd is either saying or doing.
This involves knowing how the success of the crowd, or its failure, might well distort the collective judgement of the crowd. Is the crowd greedy, or is it fearful?
Perhaps stocks are falling simply because people have been losing money in stocks.
Perhaps stocks are rising simply because they are rising.
Looking at the trajectory of the price along will not tell you this as stocks can rise or fall on high turnover or low turnover. The actual position of investors holding any security depends on the relation between current price and what they paid.
This hidden factor, the distribution of unknown cost of entry, determines how the average investor is likely to feel about the success of their investment.
Through the use of our unrealized profit-and-loss indicator it is possible to practice detachment and observe the likely sentiment of investors. Their position can then be compared with estimates of fundamental value.
When the average cost basis of a stock is well above fundamental value, that stock is at risk of selling. If the stock price were to fall below cost basis, and it is expensive, then the good feeling of unrealized gains is gone. There are just losses to come.
Conversely, when adverse market sentiment pushes a stock well below cost basis, but company fundamentals are improving, there may well be an overhang. The company fair value may be within sight, but the cost basis level is far above that. Investors are likely to spurn news that the company prospects are improving.
Their one clear goal is simply to get out of a losing position, to break even.
The Savvy Yabby as your guide
Investment is ultimately about self-knowledge married to world-knowledge.
There are no sure things in this game, but it is vital to maintain a positive perspective on your decision making. We all get things wrong, from time to time. However, what really makes a difference is knowing how to work our way out of difficulties.
The Savvy Yabby indicator can help you to flip this script by showing where many in the market are having to confront these difficulties. You can feel their joy, or pain.
Perhaps they are in a stock that has had a massive bull run, but the signs are clear that the former buffer of unrealized profits is eroding. Investors are taking their money off the table, and the average cost of entry is getting ever higher. This poses acute risks when the cost basis itself if well above fair value. The crowd has paid too much.
Conversely, there are situations where an entire industry is in the dumps, like now in the Australian market with lithium stocks. However, among some companies, value may be present, but not acted on. Too many are waiting to sell on every bounce.
Sentiment indicators, such as the cost-basis indicator, cannot tell you what to do, of themselves. However, they can give you confidence to zig when others zag.
Contrarian moves can lead to extraordinary gains.
Profitability awaits those who dare.
The Savvy Yabby chart book
Fortunately, our sentiment indicator changes relatively slowly. Remember, that trading activity drives the change in the cost basis. If only 1% of shares outstanding changed hands, then the new cost basis is 99% of the old one plus 1% of the new price.
This means that we can update the indicator weekly with no great loss of value.
Furthermore, the current numbers, which change slowly, can be compared to the most recent price, to get a handle of the likely market sentiment over unrealized profits.
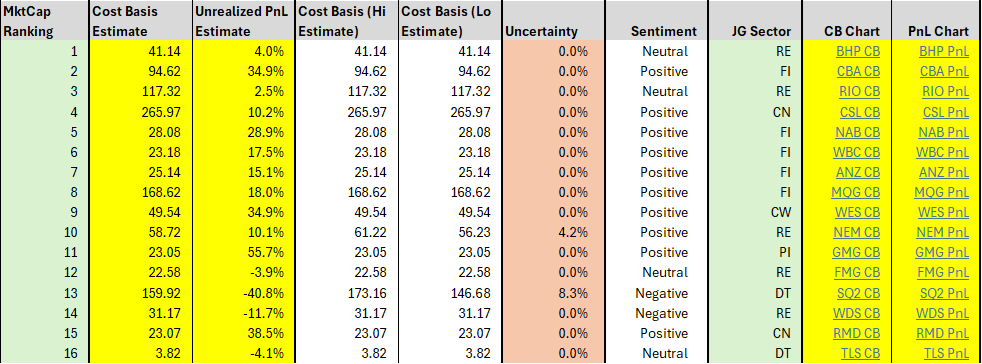
With these points in mind, the Savvy Yabby Report is designed to give you a handy weekly chart review pack, so you can filter stocks by sentiment, and refer to how present conditions have developed over five years of history.
Of course, it is important to research current events, and to follow industry prospects through company earnings reports, and other news. However, you will find, I think, that the cost-basis indicator, especially the chart version, provides useful context.
Let me illustrate with some current examples.
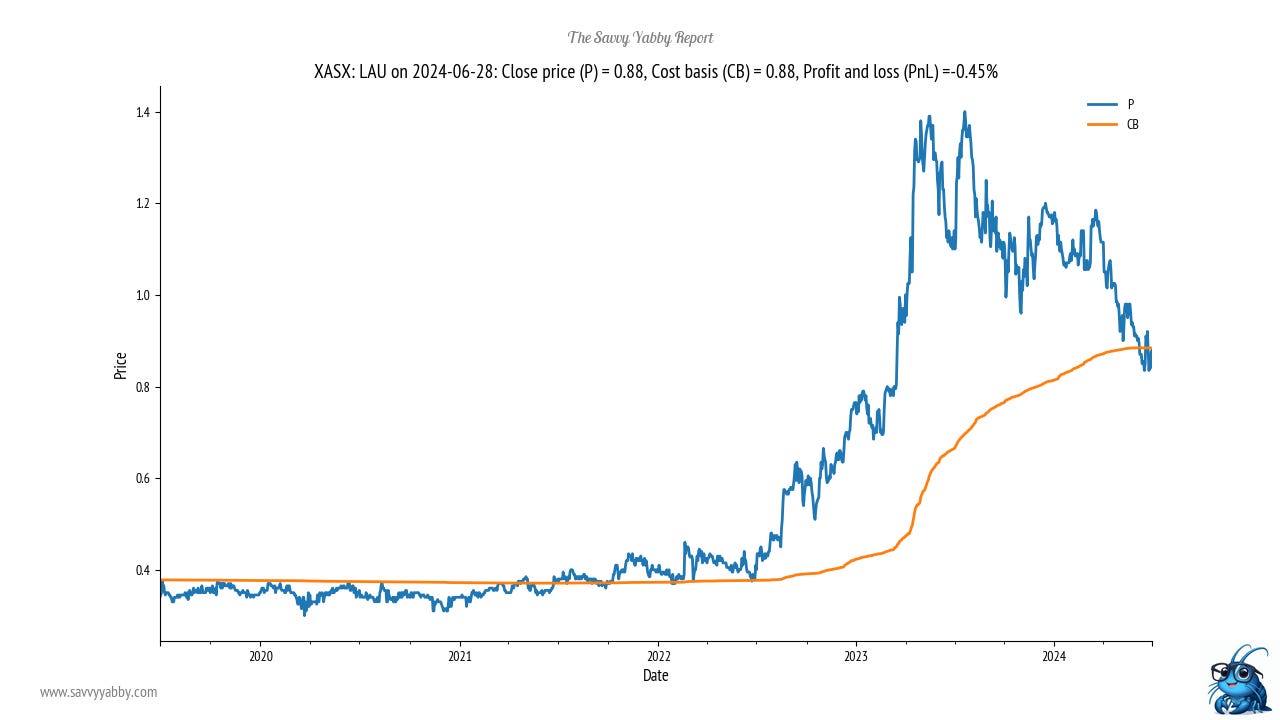
Lindsay Australia ASX: LAU is a refrigerated freight and logistics group involved in Australian farm produce supply chains. You can see that the stock awakened from slumber some years back, went on a good run, with a sharp recent retreat.
This chart could look very scary to some but note that it has simply pulled back to the estimated cost-basis. The dividend rate is running at 4 to 5c per share fully franked. The payout ratio is modest at 43%, with a 5.80% running yield.
This is the type of situation that can repay further research.
We can surmise that it got overextended and then pulled back.
Why was that? Did the outlook collapse? What does management guidance look like?
These are threads we can take up more fully when researching industries as a group.
However, you can see the point. It looks like freefall, but something caught that.
The stock has paused around cost-basis, and we need to assess if that is fair value.
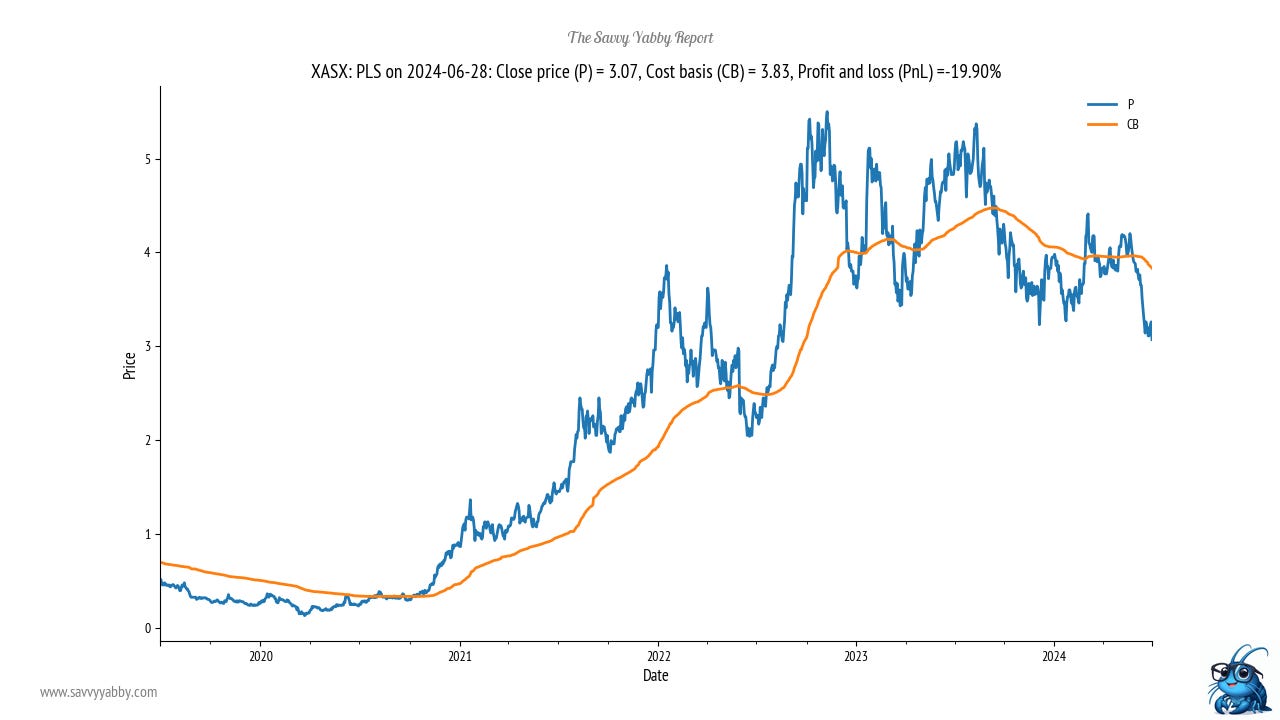
Here is another example with lithium producer Pilbara Minerals ASX: PLS.
The stock sold down heavily this tax-loss selling season. The cost-basis is estimated to lie about 25% above current levels at $3.83. Clearly, the sentiment is negative.
Last week the company made a major presentation on their expansion plans.
Are they nuts, or is this a contrarian play on an oversold market?
When you frame research questions in this way, it becomes easier to weigh up the key factors of importance:
What does management think?
What does the market at large think?
What do I think?
We all think differently, but I continue to hold this stock in my own portfolio.
I can be cognizant that the market is likely pretty bearish, due to the unrealized losses for most investors, and so am unsurprised there was no rally for the expansion plan.
Does this mean the expansion plan is misguided?
We cannot know until the future arrives.
However, I am prepared to take contrarian positions when I feel that what I think about the rational prospects for a company or industry are being downplayed.
The reason for this is generally the negative emotion of losses.
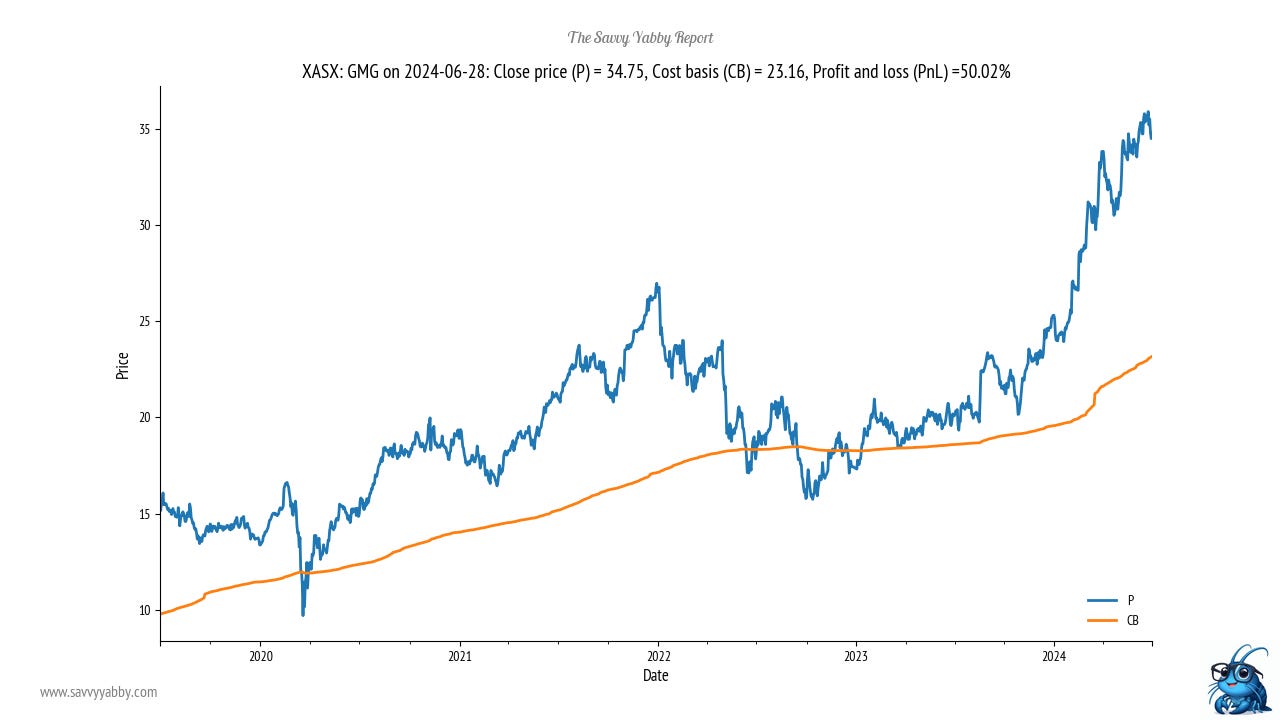
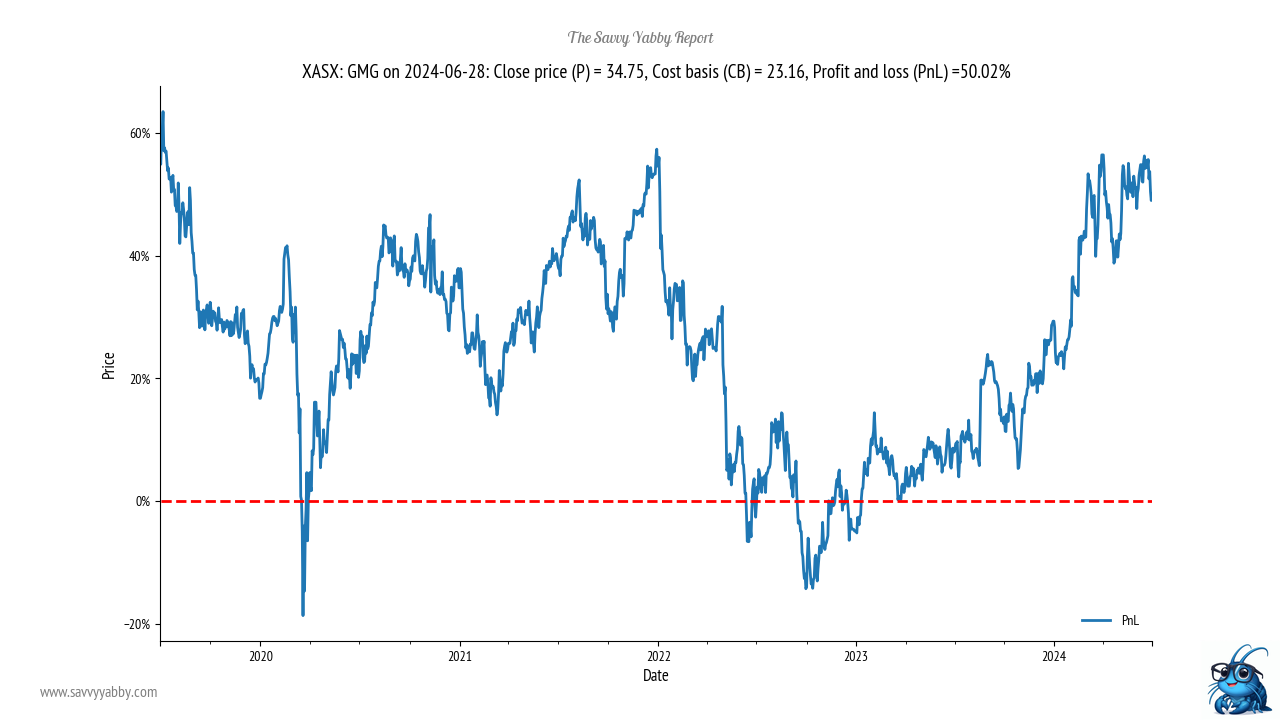
Let us now look at the flip side to this question, with Goodman Group ASX: GMG.
This has been doing super well, as you can see in the unrealized profit and loss chart.
Do you see how the unrealized profit and loss buffer is now nudging 60%. Put that in perspective, for just a moment. We are saying that on average investors in Goodman have paper gains of around 60%. That is pretty good, and so profit taking is likely.
Would you sell the stock for that reason?
That really depends on you, but those who hold it are probably excited by attractive long-term prospects in data centres and warehouse infrastructure.
Perhaps the middle road is to wait on a possible pull back before adding to it.
The ASX chart book drops tomorrow
Thank you to everybody who has supported us in our journey so far!
We passed 100 subscribers last week, which is a huge milestone.
This is very motivating for me, so I have been working hard to beef up our offering and deliver more value to you, our readership. Your support is what keeps our story going and is the fuel for our passion to keep building out systems.
Tomorrow, we launch the Savvy Yabby Chart Book.
Yeah, it is a bit old school, in that you get an Excel book!
However, you also get a zip file chart pack of 3,748 charts, just like the ones above.
What makes this work is the clickable image links.
This is like a static website and loads fast.
Just don’t try it on your smart phone :-)
There will be the usual top-20 free version for free subscribers, plus two other versions.
The top 500 stock version is 50MB as a clickable download.
The top 1878 total market version is 350MB as a clickable download.
These are links, so they will not break your inbox.
I will have comments enabled for readers to suggest improvements. For licensing reasons, we cannot give you a data dump, but we can do a chart pack.
This is a creative solution to put our indicator in your hands.
Perhaps, one day, we will have a real-time website.
However, we are not there yet.
Thanks for your support!
Savvy Yabby out.


